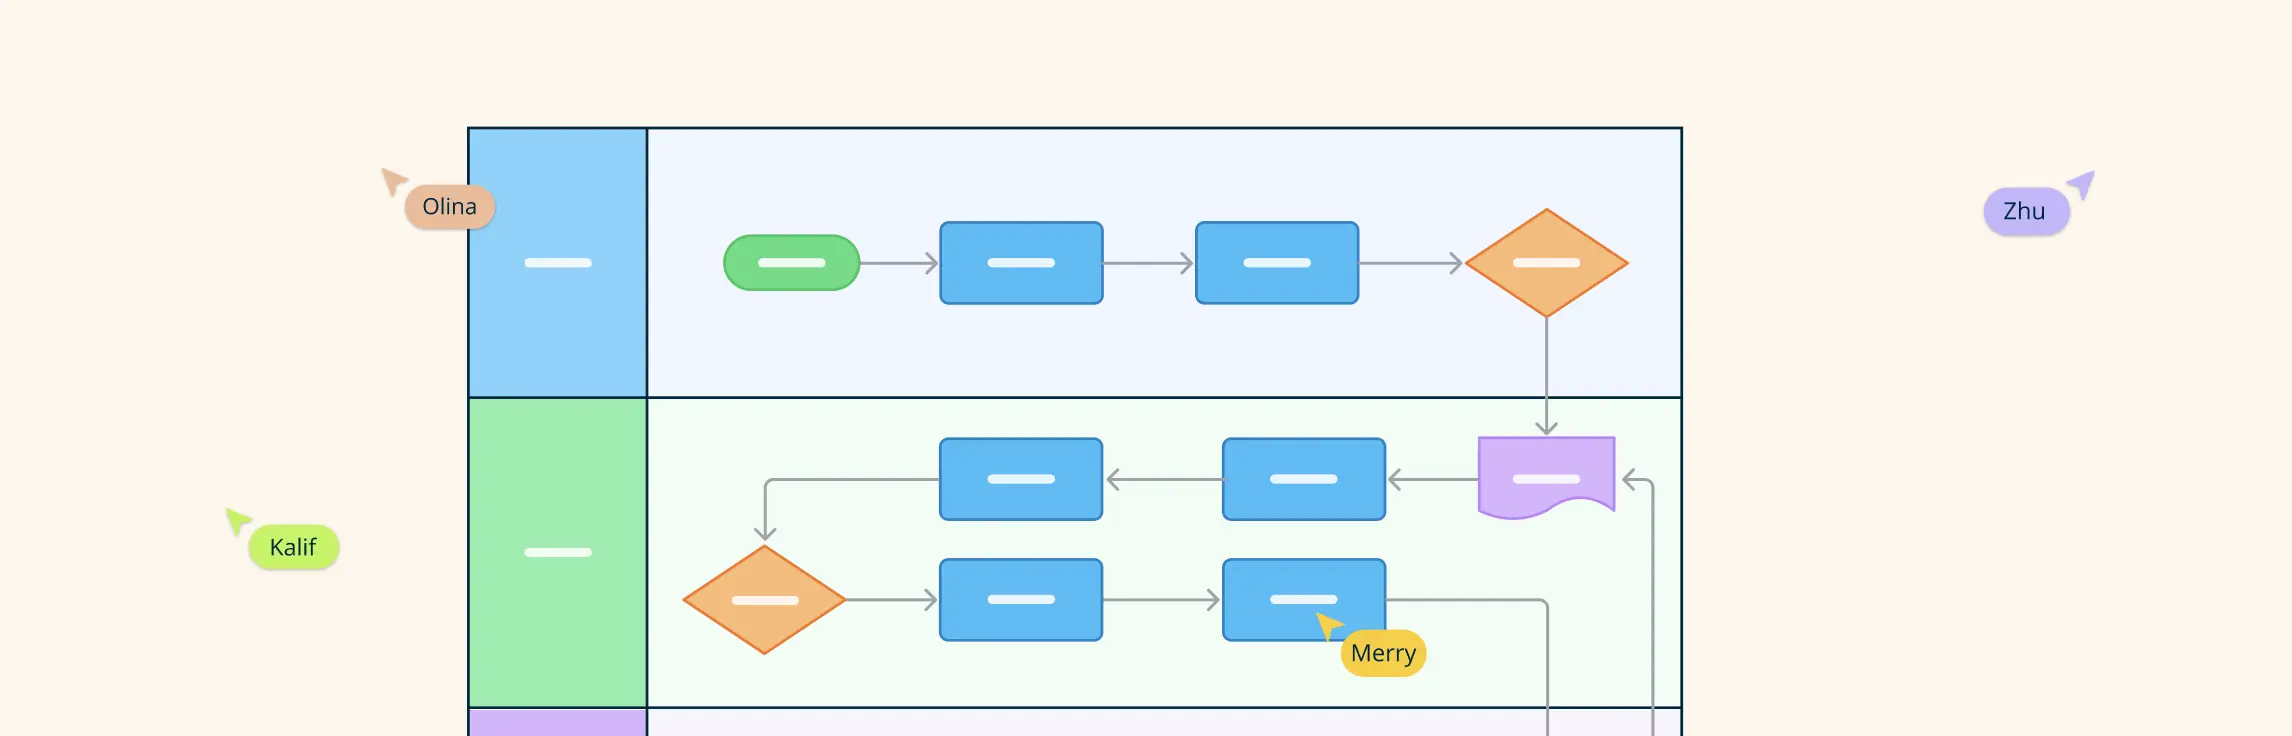
Easily visualize your processes and workflows with smart automation.
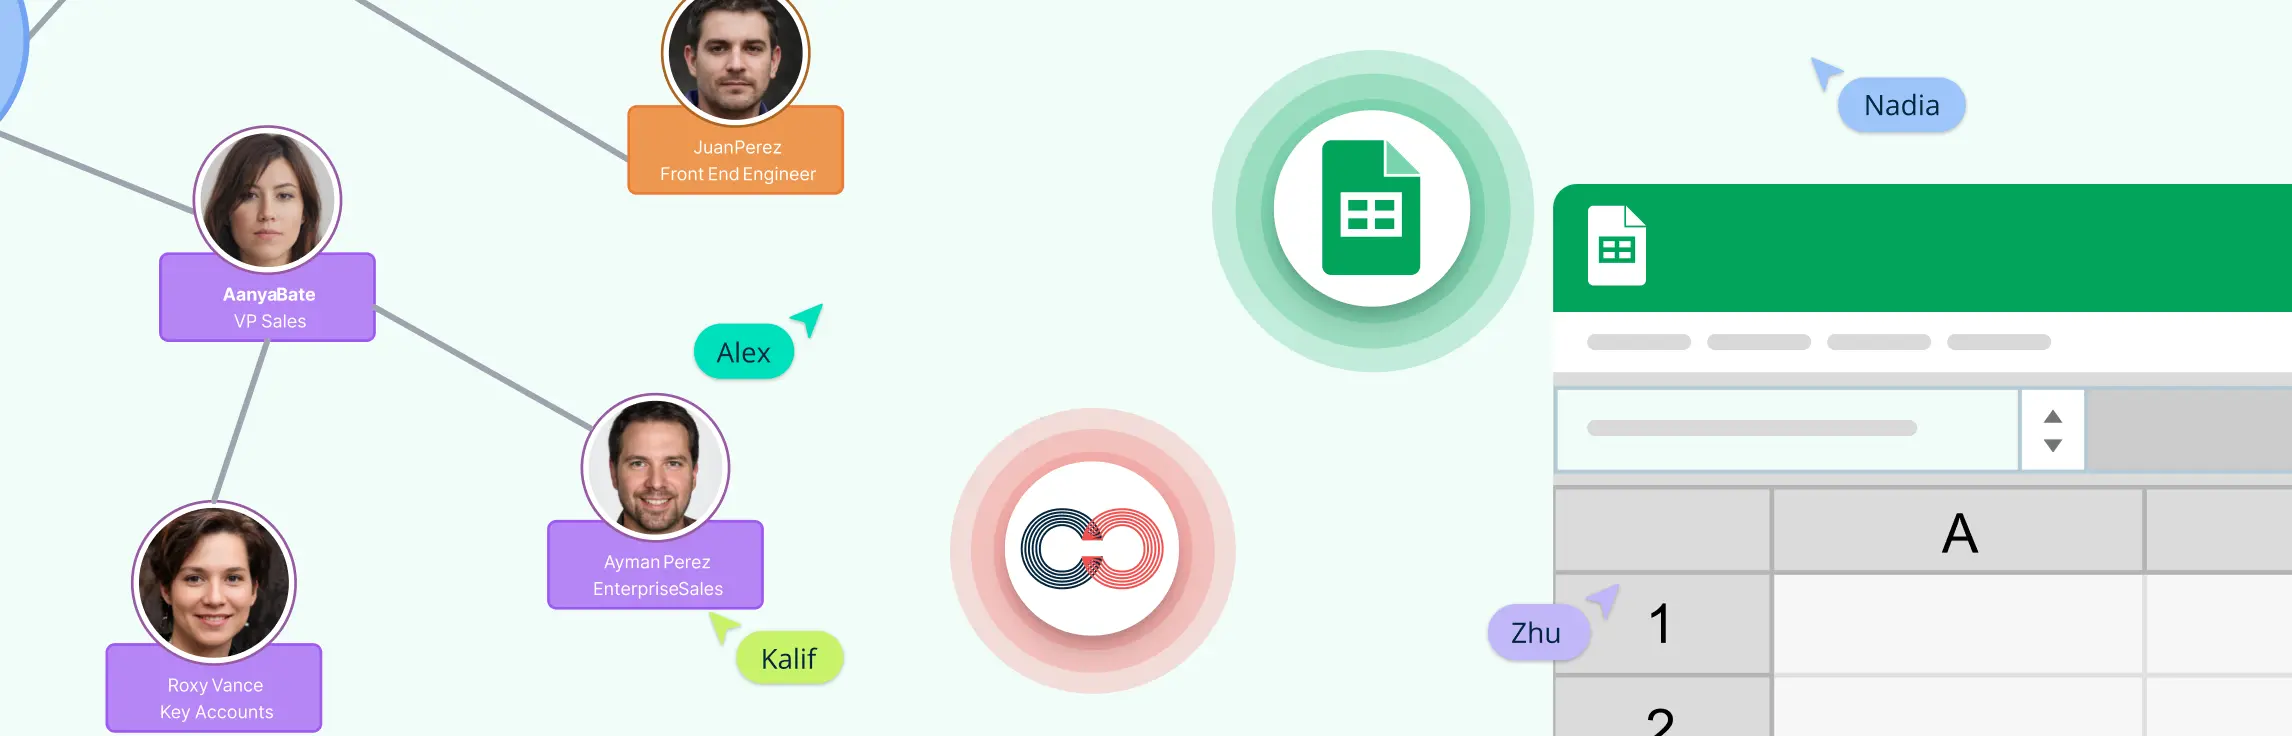
Create visual organizational structures with images and detailed profiles.
Visualize concepts and their relationships on an infinite visual canvas.
Map family history and understand the relationships with detailed genograms.
Visualize relationships between entities using Crows Foot or Chen notation.
Visualize your network infrastructure. Support AWS, CISCO, Azure and more.
Visualize and expand your ideas using our powerful mind mapping tool.
Easily create family trees with our professionally designed templates.
Infinite canvas to add diagrams, images, sticky notes and more.
Run collaborative meetings, workshops or brainstorming sessions.
Collaborative diagramming for educators and students at discounted rates.
Log In
Sign Up Free
If you need a short answer, use a screen-capture tool when speed matters most, use a wiki-first tool when your main job is publishing procedural knowledge, and use a process-modeling platform when you need documentation that stays governed, visual, and current across teams. For most ops and process owners, the right choice depends less on template count and more on whether the tool can handle ownership, change control, and cross-functional process logic without turning your documentation into another stale folder of files.
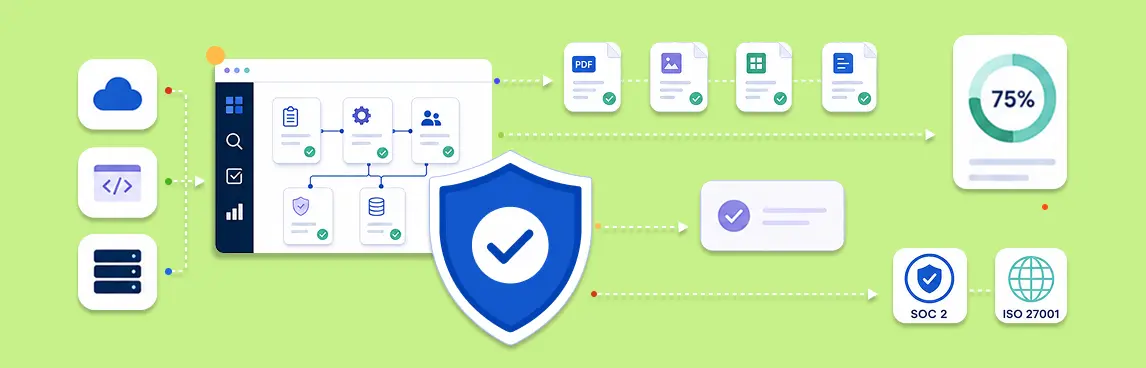
SOC 2 readiness means every applicable criterion can be traced to a defined control, an operating procedure, current evidence, a named owner, and a reviewer conclusion. Build the evidence pack from those relationships. Do not start by collecting screenshots into folders and try to explain them later.
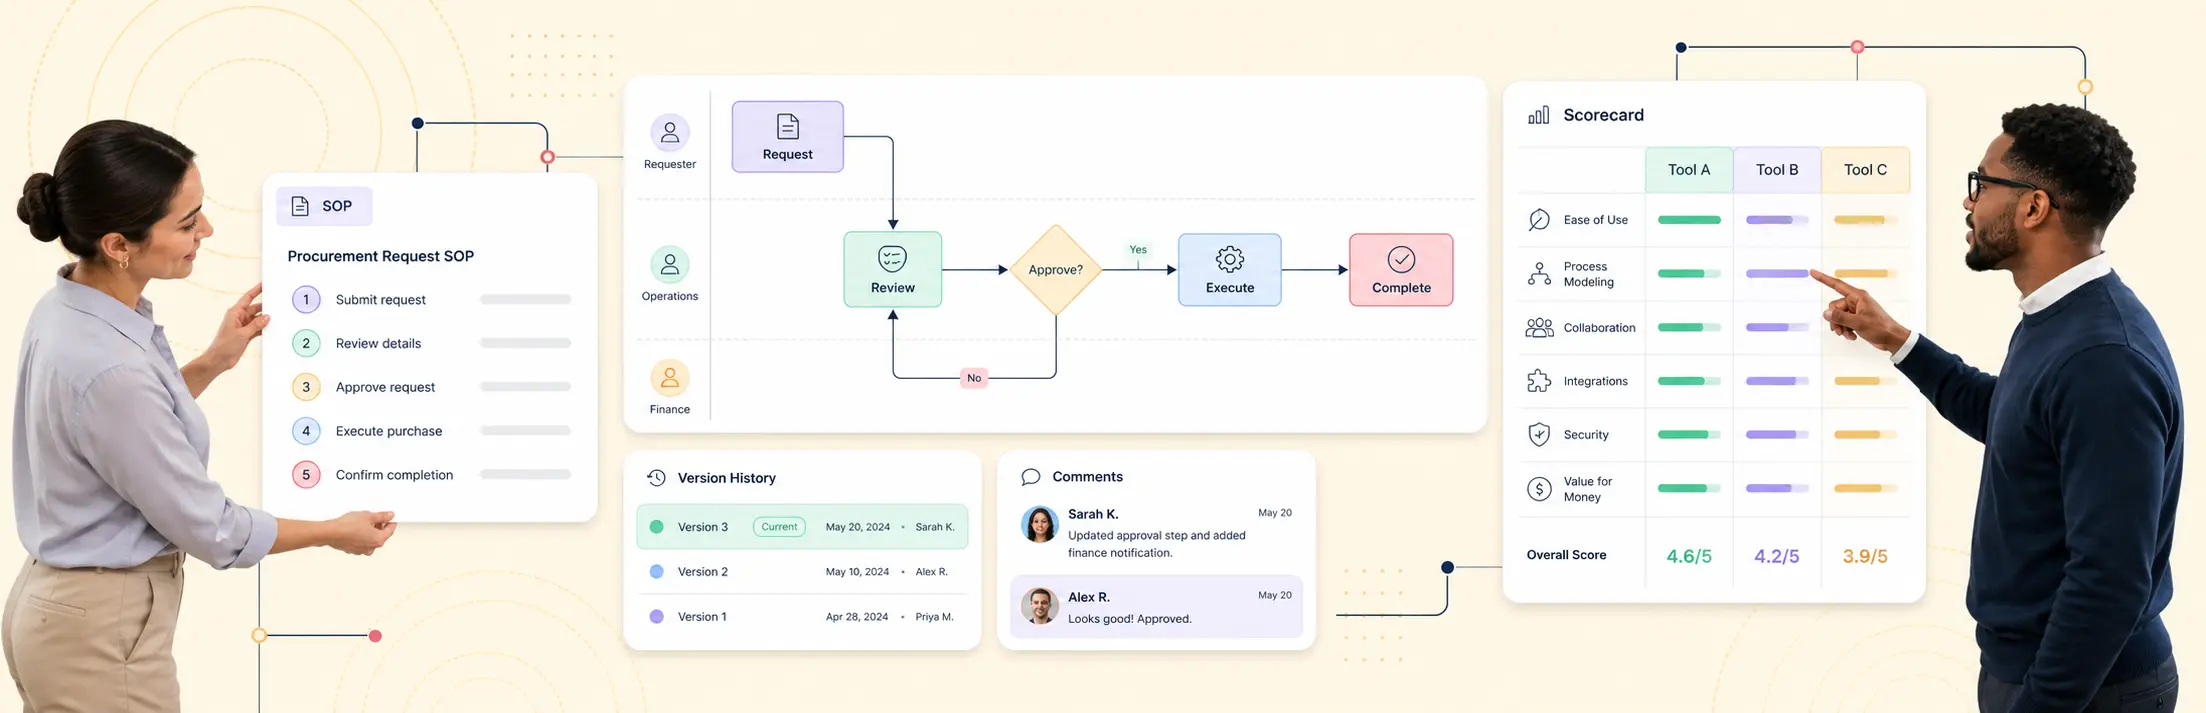
The best process management software gives teams one living repository for how work runs. It should combine clear process maps with controlled documentation, version history, named ownership, responsibility mapping, evidence, review workflows, and BPMN when formal modeling is needed.
Process documentation supports audit evidence when each control claim connects to an approved procedure, accountable owner, effective version, operating records, and reviewer conclusion. Creately Process models how the control should operate. Creately Compass connects that model to requirements, controls, live evidence, exceptions, and review decisions.
Move scattered SOPs into a living process repository by consolidating current procedures, assigning accountable owners, controlling versions, connecting related processes and evidence, and putting every document on a review cycle. Do not start by uploading every PDF. Start with one process family, prove the governance model, and expand from there.
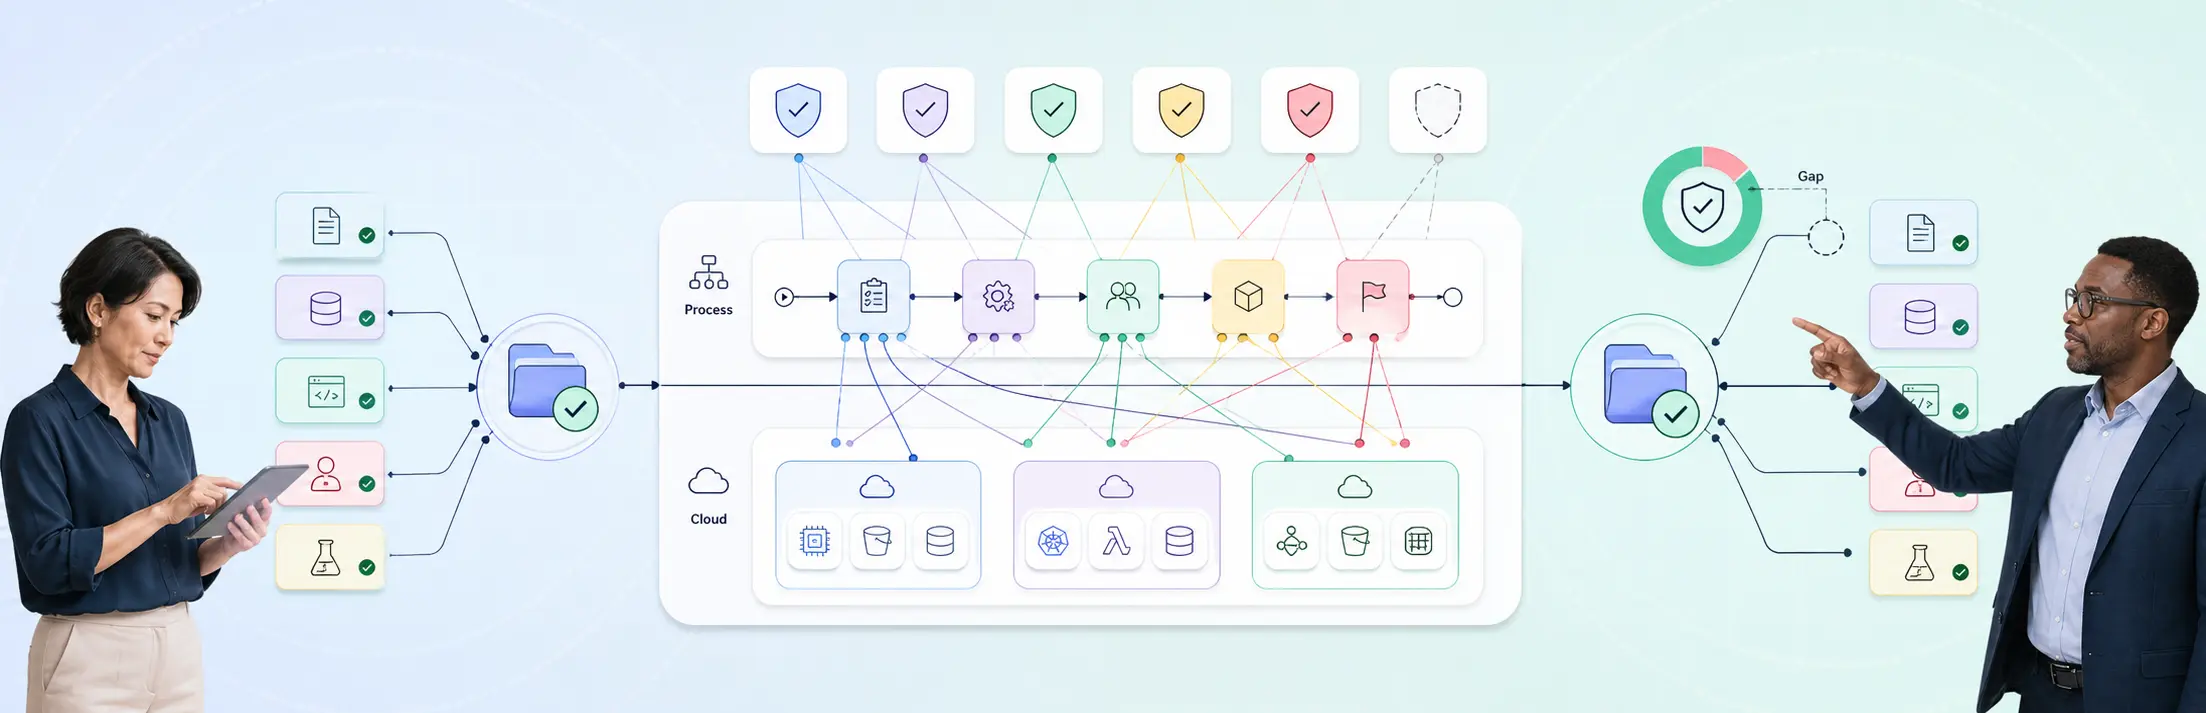
Federated control evidence proves coverage by connecting process documentation and live cloud facts to the same control model. The evidence can stay in authoritative systems, but its source, scope, capture time, owner, validity, and review state must be visible in one assurance graph.
Continuous audit-readiness software should keep control requirements, operating procedures, evidence, owners, and reviewer decisions connected throughout the year. For SOC 2 and ISO 27001, the right system does more than collect screenshots. It shows what each control requires, where its evidence comes from, whether that evidence is current, who reviewed it, and what remains unresolved.
Processes shape how work gets done every day, but when steps exist only in people’s heads or across scattered documents, the process becomes hard to review and even harder to improve. Tasks slow down, responsibilities become unclear, and small issues grow into larger operational problems. Process mapping helps teams turn that hidden work into a visible workflow they can understand, improve, standardize, and keep current.
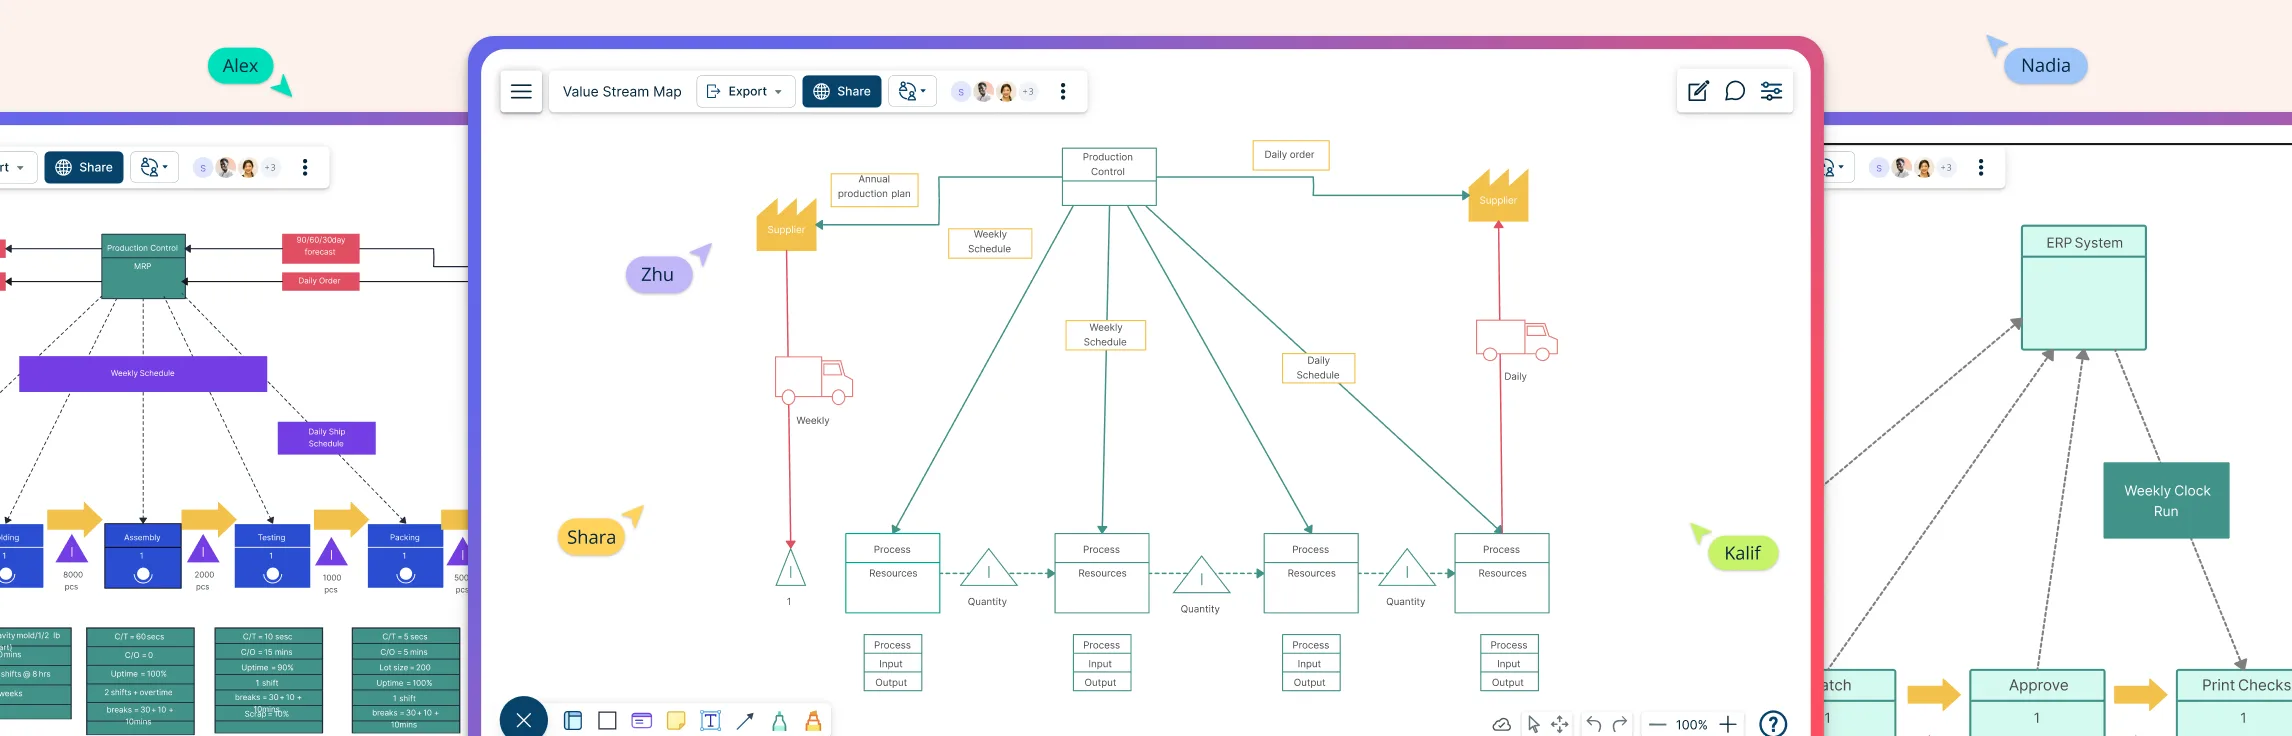
Value Stream Mapping Tutorial This guide explains what value stream mapping is, when to use it, and how to build current-state and future-state maps that reveal waste, bottlenecks, and improvement opportunities. It also covers the sections of a value stream map, the metrics to capture, and practical ways to turn observations into an action plan.
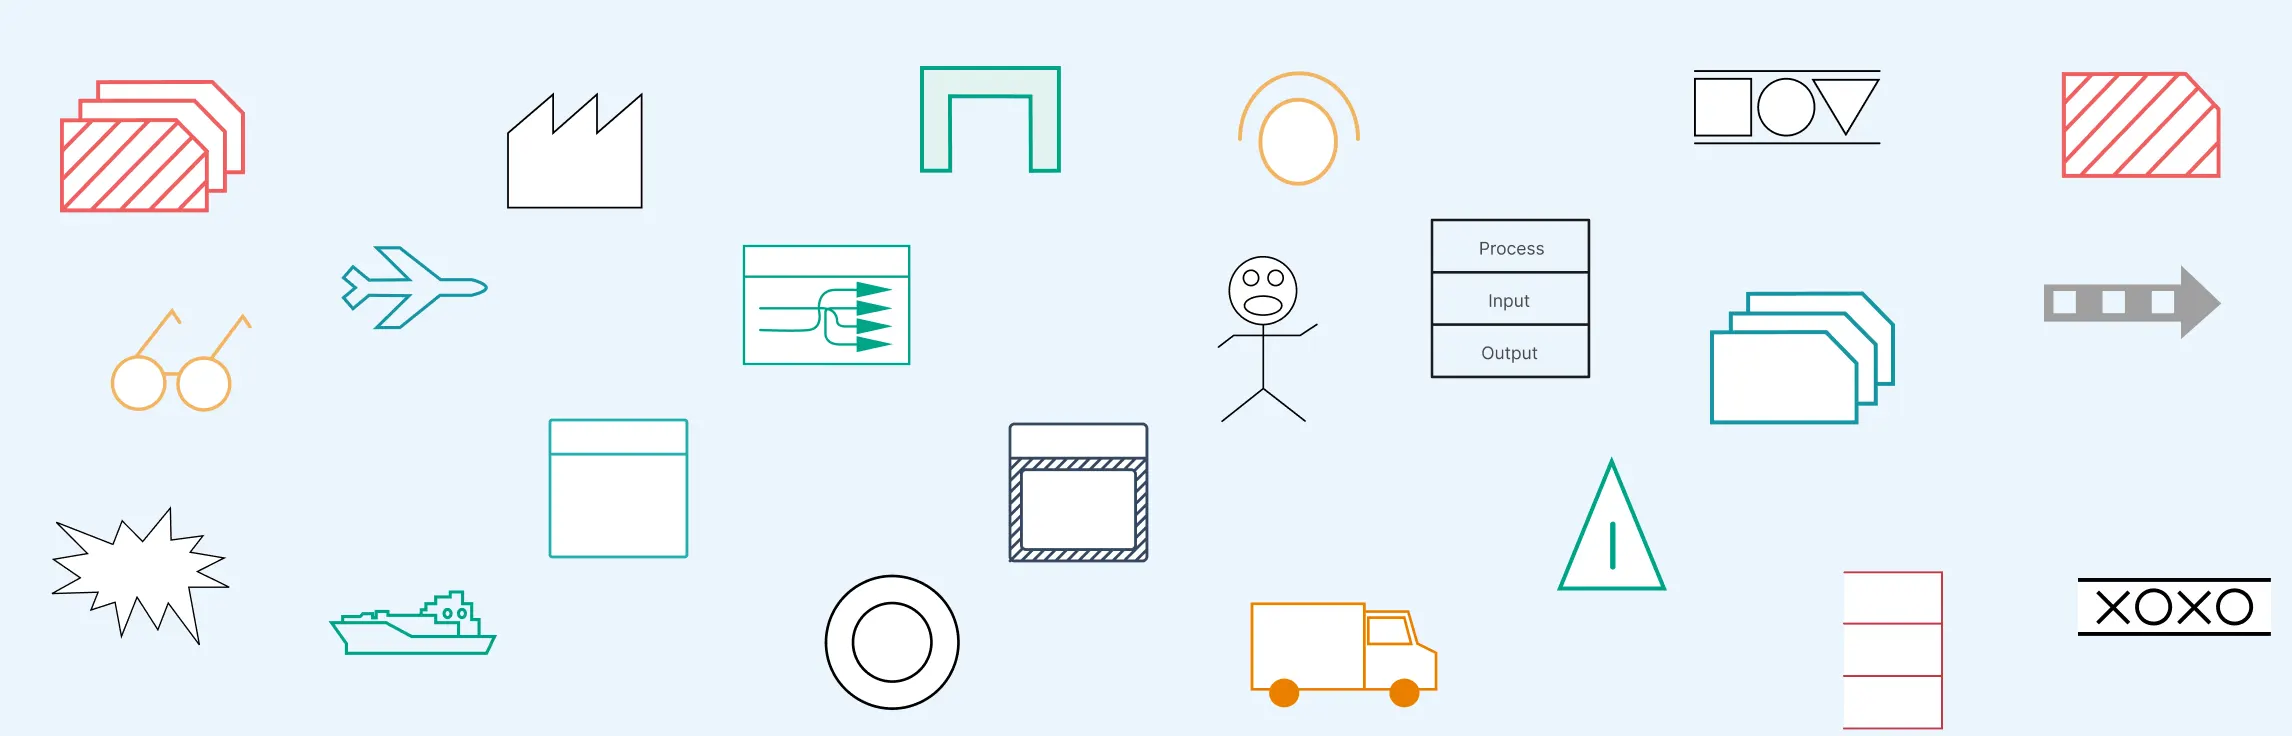
If you’ve ever tried value stream mapping and felt overwhelmed by unfamiliar icons, cluttered diagrams, or symbols that weren’t clearly explained, you’re not alone. This guide breaks it all down, starting with what value stream mapping is, followed by a clear explanation of value stream mapping symbols and meanings. You’ll see what each value stream icon represents, when to use it, and how it fits into the bigger picture, along with practical tips to avoid overcomplicating your map and turning insights into action.
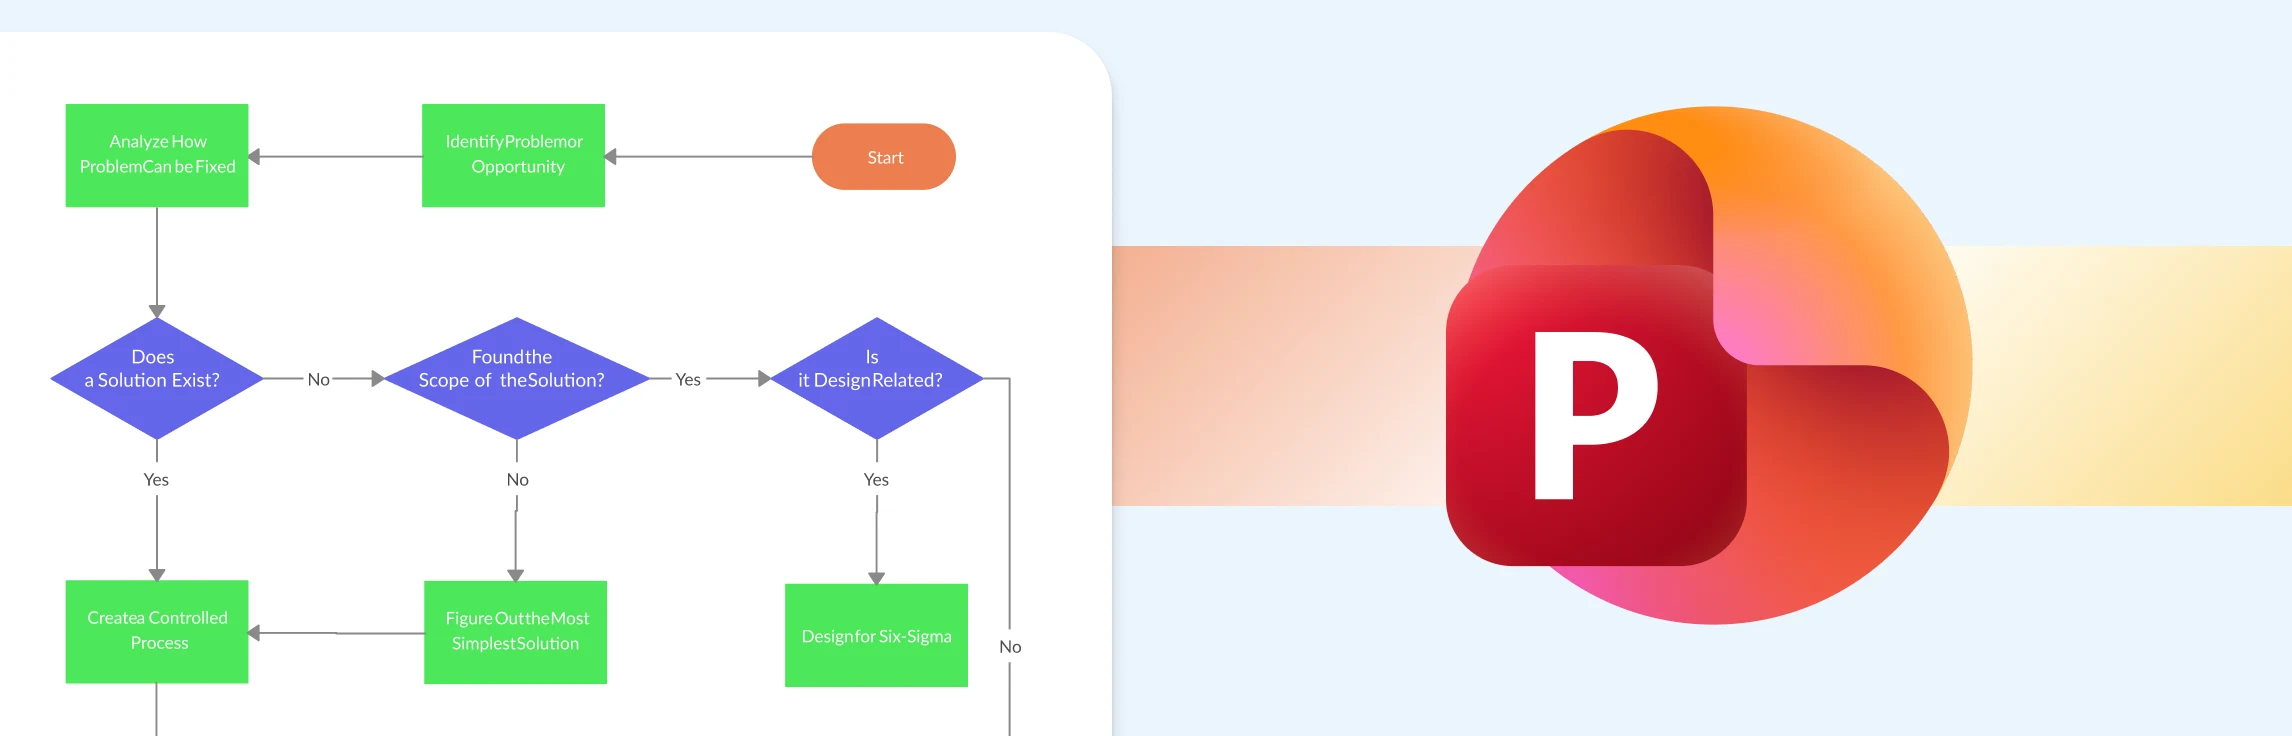
This guide explains how to create a process map in PowerPoint with SmartArt, from choosing a layout to reviewing and sharing the finished workflow. It also covers where PowerPoint works well, the limitations that appear as a process becomes more complex, and when a dedicated process mapping tool is a better fit. Free process map templates are included to help you get started.
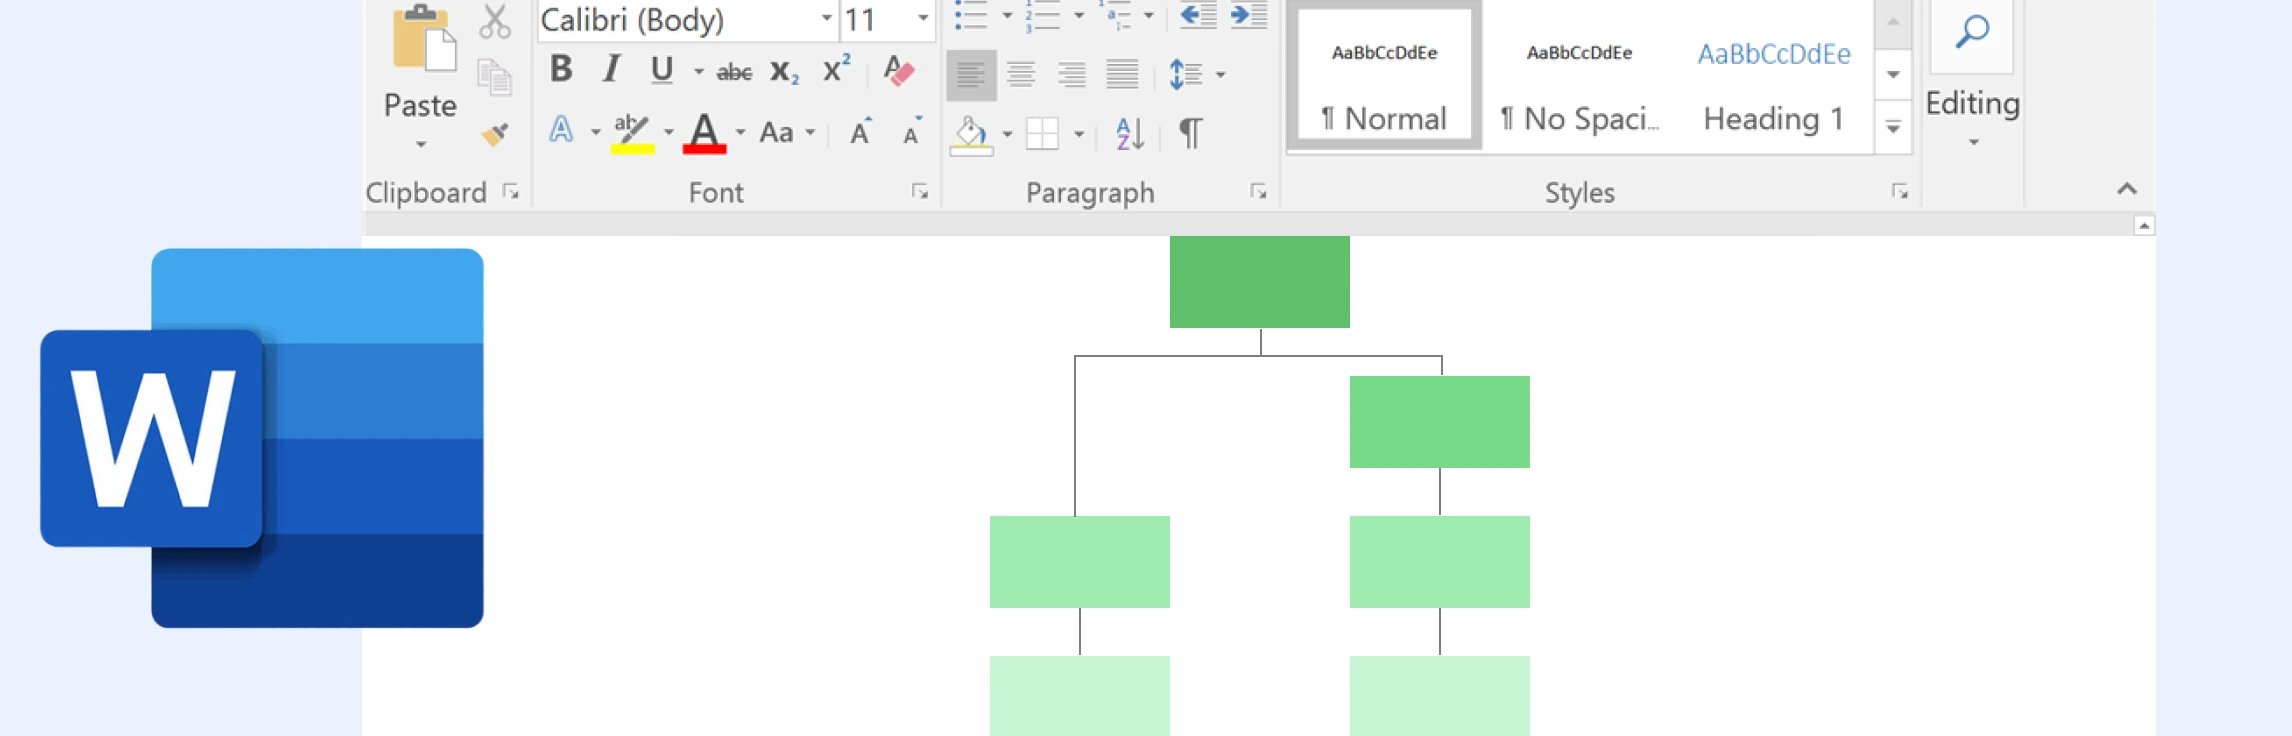
Learning how to create a process map in Word is useful when you need a simple workflow diagram in a familiar document. This guide explains the steps, Word’s practical limitations, and when a dedicated process mapping tool is a better fit. It also includes a feature comparison and free templates to help you choose the right approach.
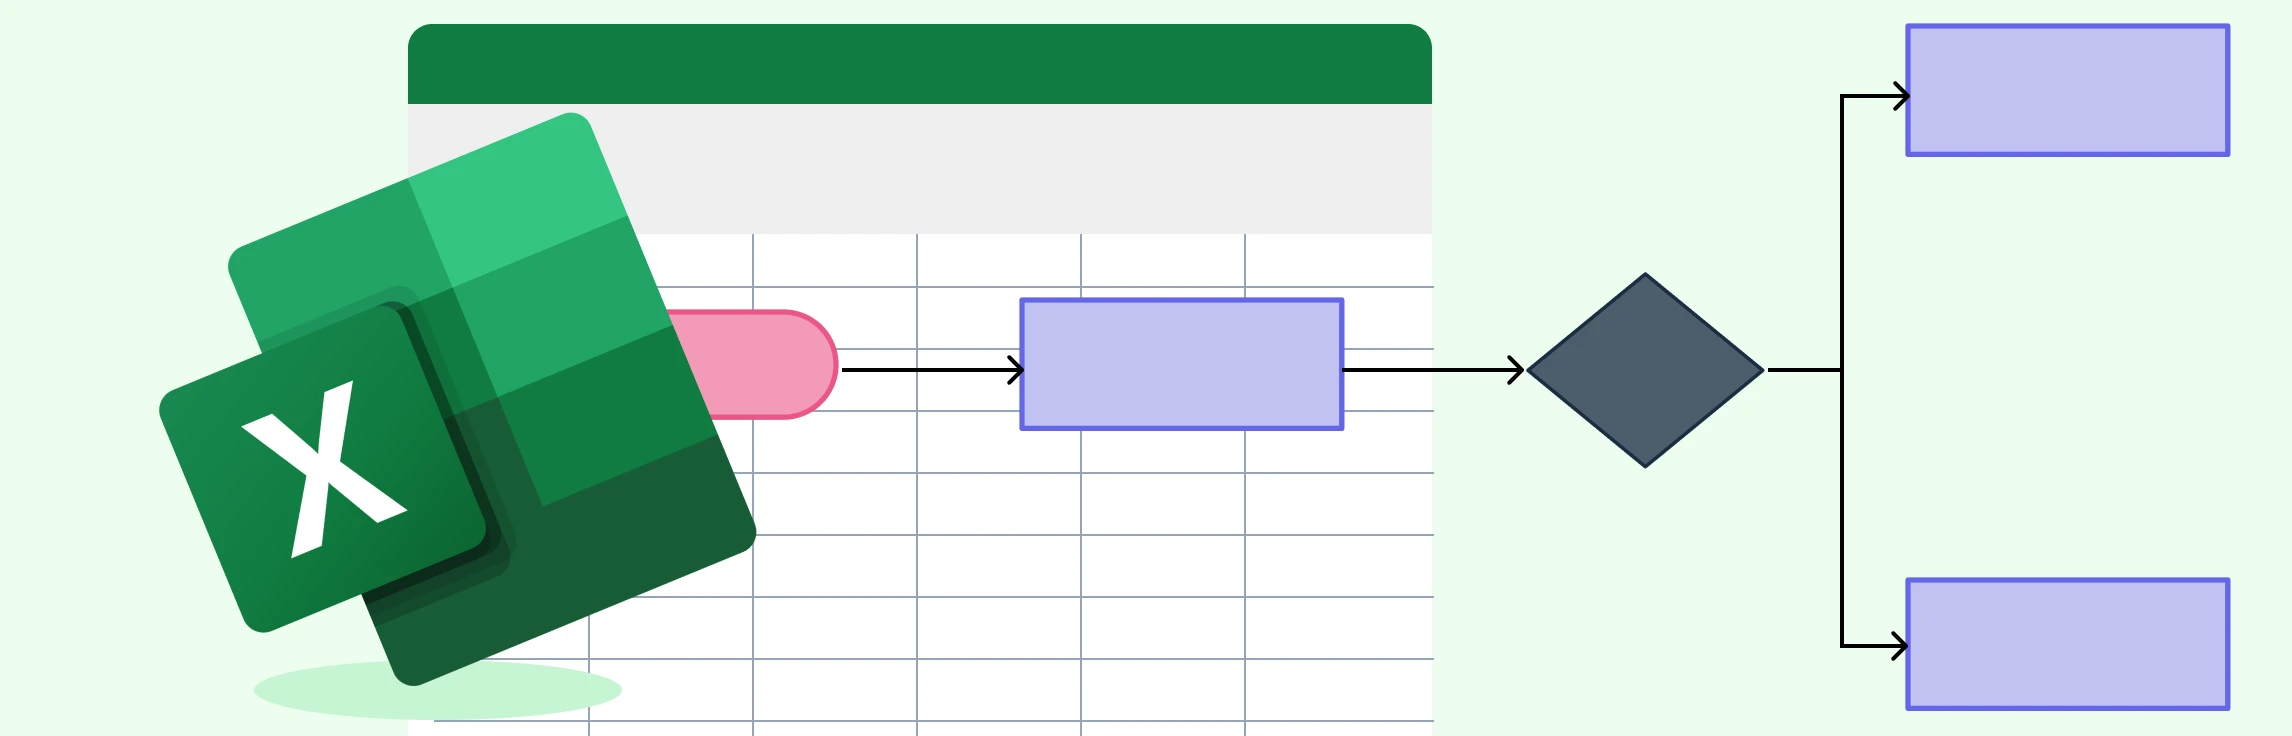
This guide walks you through the steps for how to create a process map in Excel, highlights the challenges you may encounter on the platform, and introduces a more efficient alternative for teams that need faster, clearer, and more scalable process mapping.
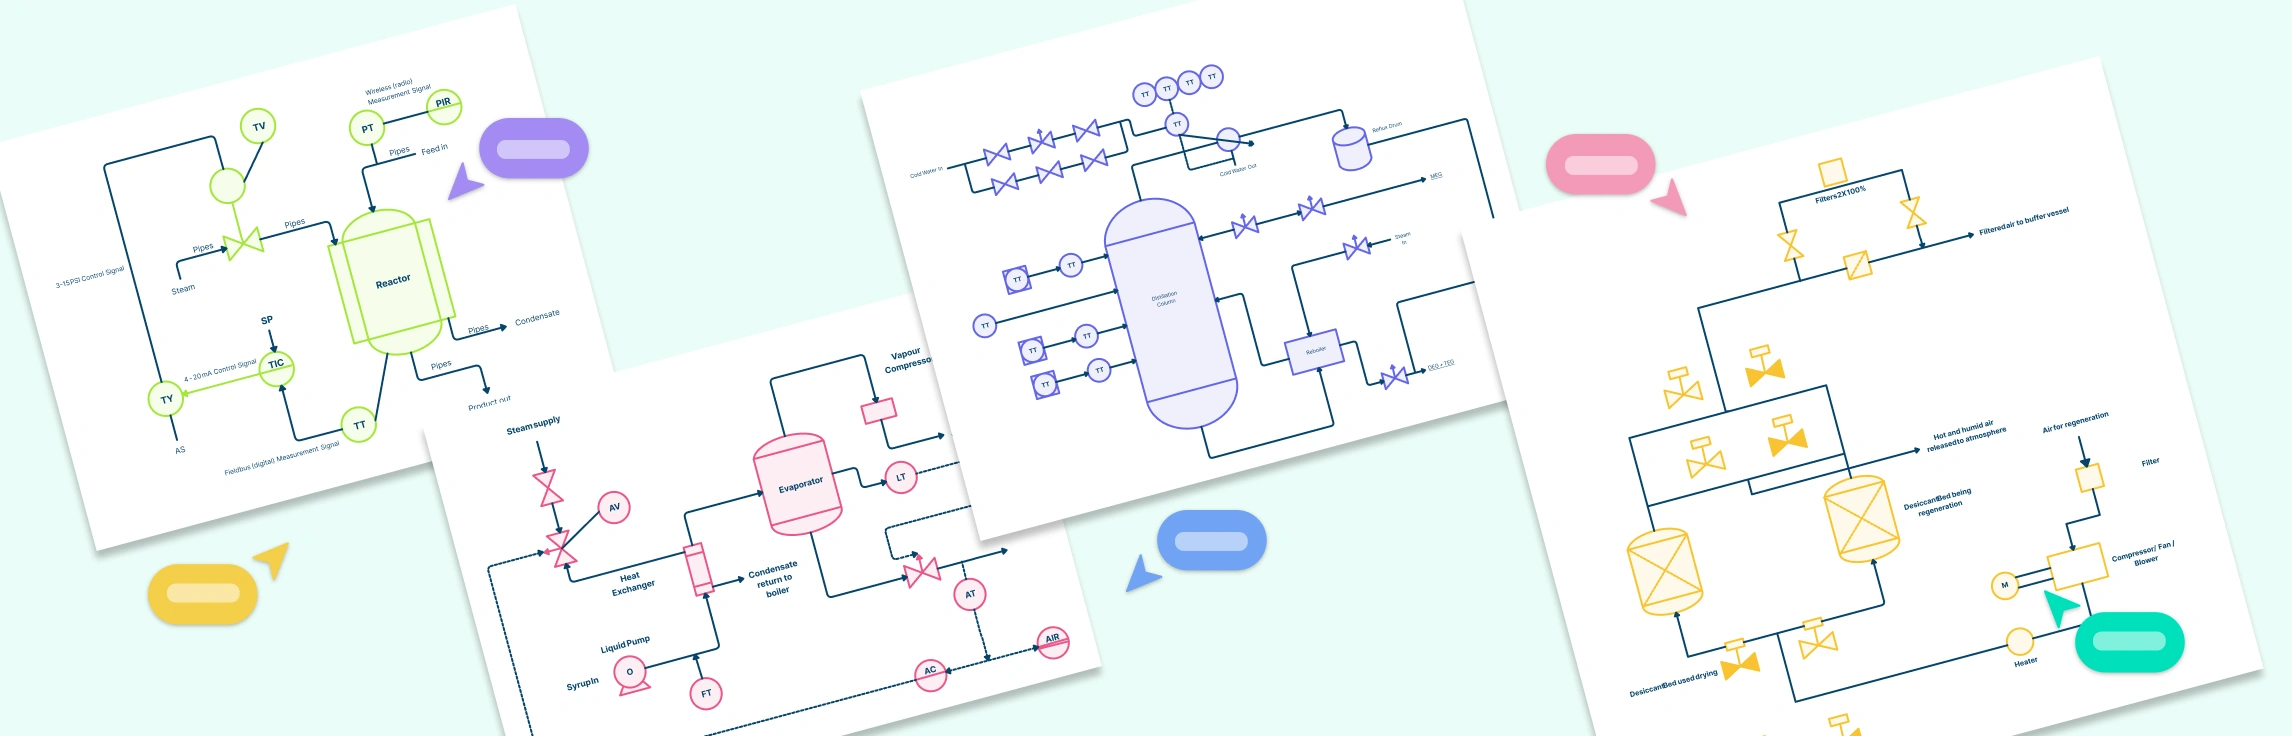
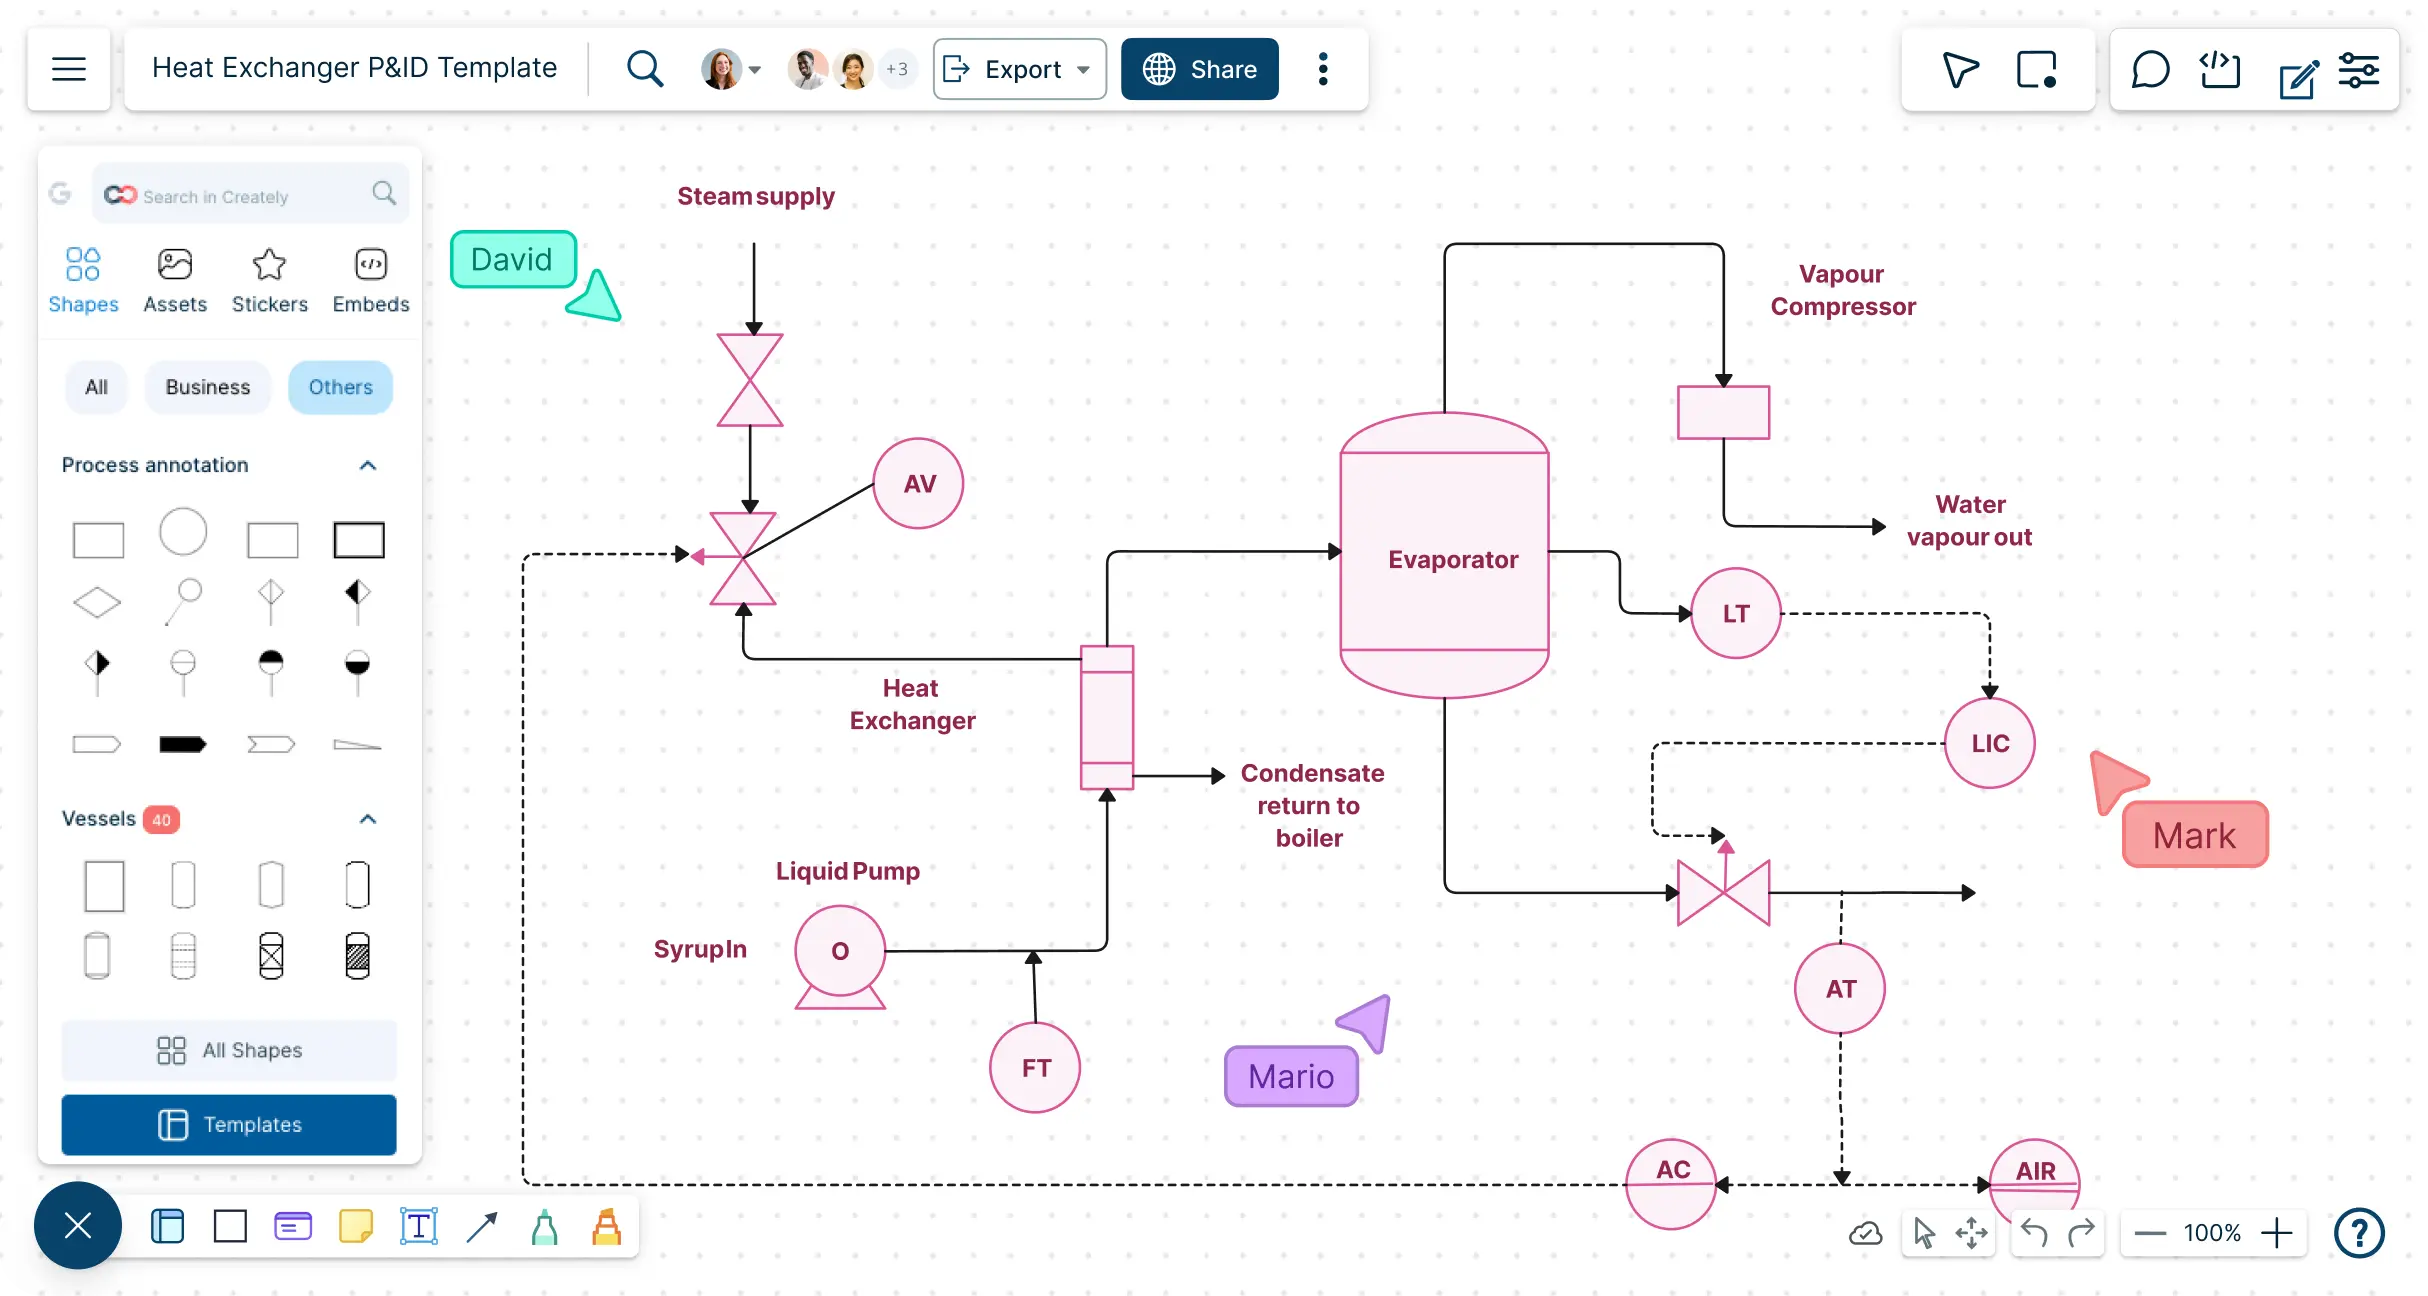
Piping and Instrumentation Diagrams (P&IDs) are essential tools in process engineering, helping professionals visualize systems, monitor controls, and optimize workflows. Whether you’re designing a chemical reactor, managing a heat exchanger, or planning large-scale production processes, having clear and accurate P&ID examples can save time and reduce errors.
Streamline process design with Creately’s intuitive piping and instrumentation software. Create precise, standardized diagrams faster and save hours in validation and documentation.
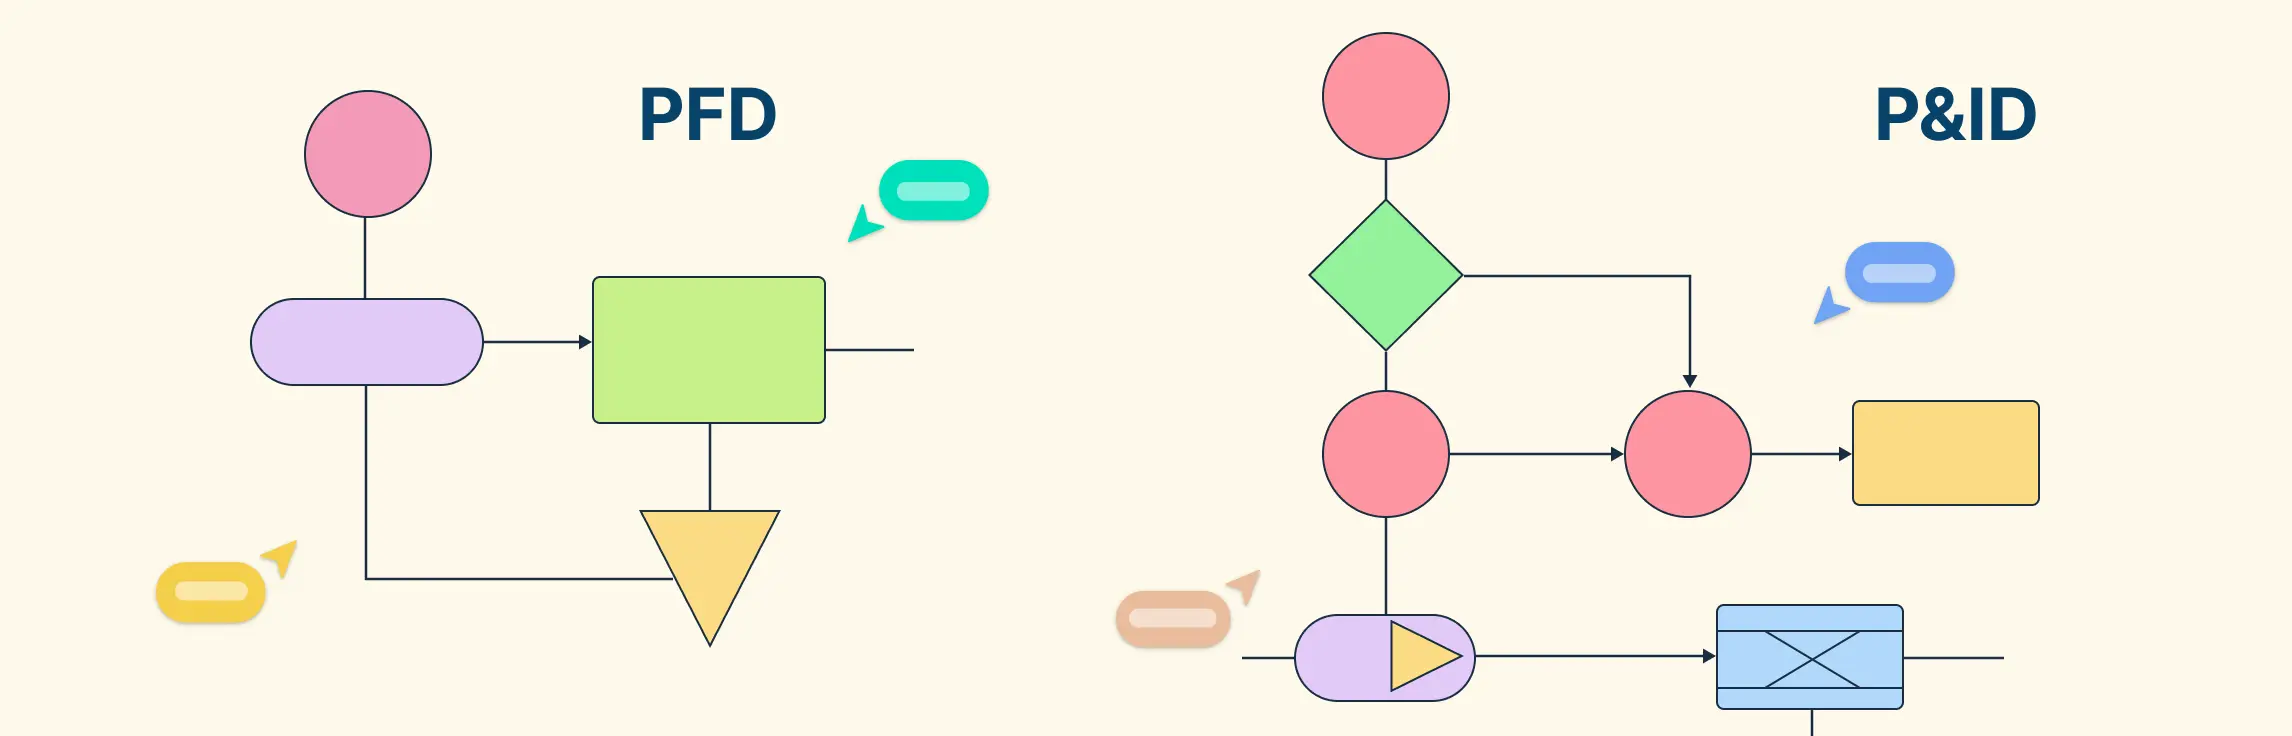
In industries like chemical, mechanical, and process engineering, diagrams help teams plan, design, and run complex systems. Two key diagrams are the process flow diagram and the piping and instrumentation diagram ( PFD and P&ID).
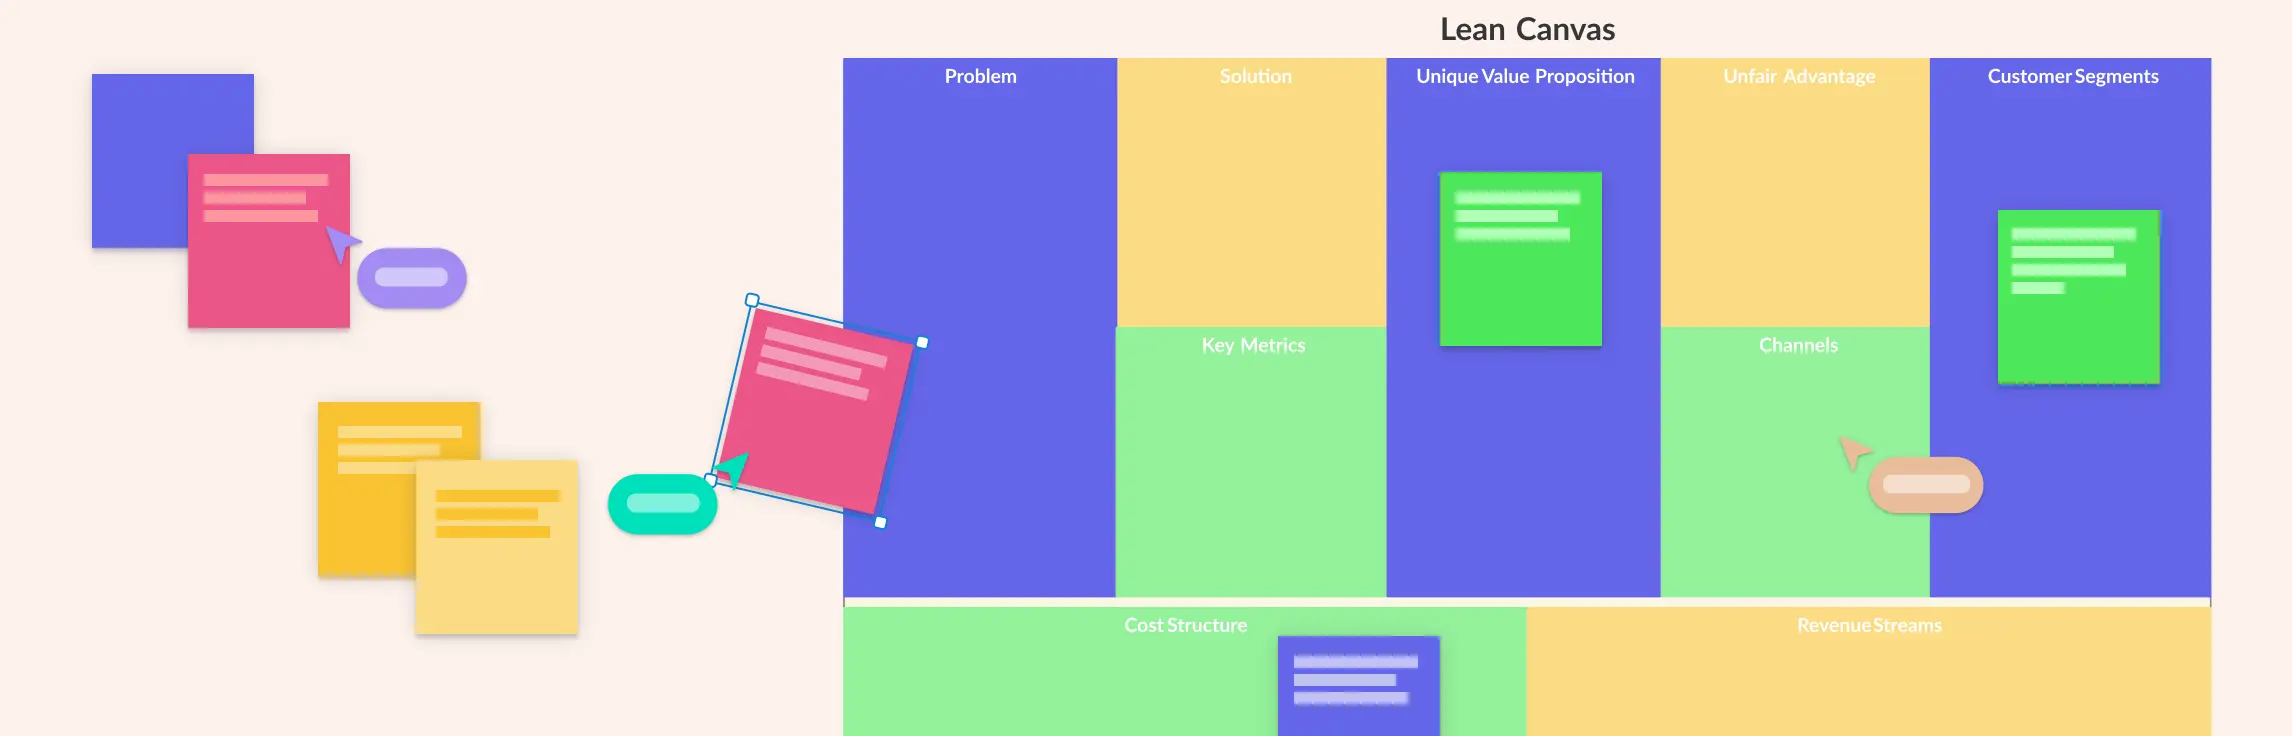
Starting a business is exciting, but turning an idea into a working business model can feel overwhelming. That’s where the Lean Canvas comes in—a simple, one-page tool that helps you map out your idea, identify key problems, and plan how to deliver value to your customers. In this guide, we’ll walk you through real-world Lean Canvas examples from successful startups, showing you exactly how to structure your own canvas.
In this guide, we’ll explain what a block flow diagram is, its purpose in process design, the key components that make it effective, and how to create one. You’ll also learn how it compares to more detailed diagrams like process flow diagrams, along with its benefits, limitations, and practical uses in engineering workflows.
Understanding what is a Piping and Instrumentation Diagram (P&IDs), is essential for anyone involved in process design, engineering, or plant operations. These diagrams serve as the foundation for building, analyzing, and maintaining complex systems safely and efficiently. In this guide, we’ll explore what is P and ID, their purpose, key components and real-world engineering applications.
Understanding Piping and Instrumentation Diagram (P&ID) symbols is essential for anyone involved in process design, engineering, or plant operations. These standardized symbols form the visual language of process systems, allowing engineers to design, communicate, and maintain complex industrial setups accurately. In this guide, we’ll break down the different types of P and ID symbols, the international standards that define them, and the best practices to follow when creating or reading P&ID diagrams.
In this guide, we’ll explain why it’s important to understand piping and instrumentation diagrams, break down how to interpret lines, labels, and tags, and walk you through a step-by-step method for how to read piping and instrumentation diagrams. This also covers common notations, abbreviations, and best practices to help you confidently analyze and work with these critical technical documents.
Starting a business can feel overwhelming, with countless decisions to make and uncertainties to navigate. The Lean Business Model Canvas helps entrepreneurs focus on what truly matters—understanding customers, testing ideas quickly, and iterating on solutions without wasting time or resources. In this guide, we’ll walk you through a practical approach to using the canvas effectively, offering tips, examples, and strategies to turn your ideas into actionable plans.
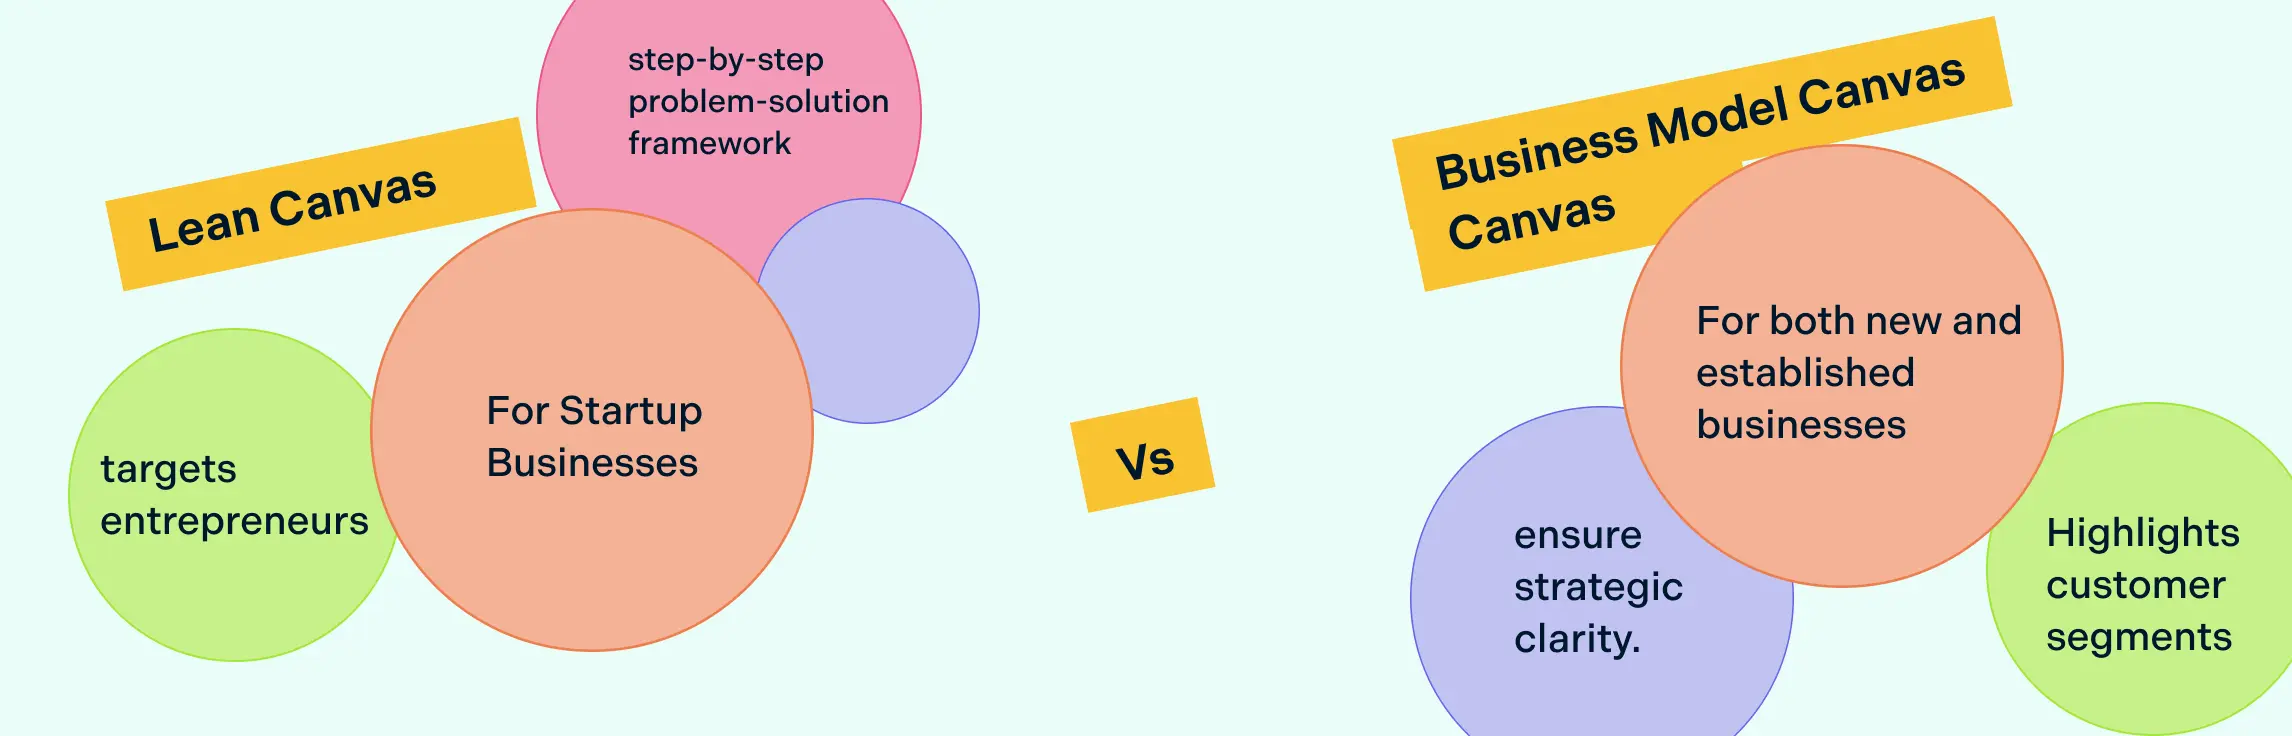
Building a business idea doesn’t have to start with a long, complicated plan. Single-page canvases like the Lean Canvas and the Business Model Canvas help you quickly map out how your idea creates value and works as a business. In this guide, you’ll learn what makes each canvas unique, when to use them, and how to choose the right one for your stage. We’ll also look at lean canvas vs. business model canvas examples and ready-to-use templates to help you put your ideas into action fast.
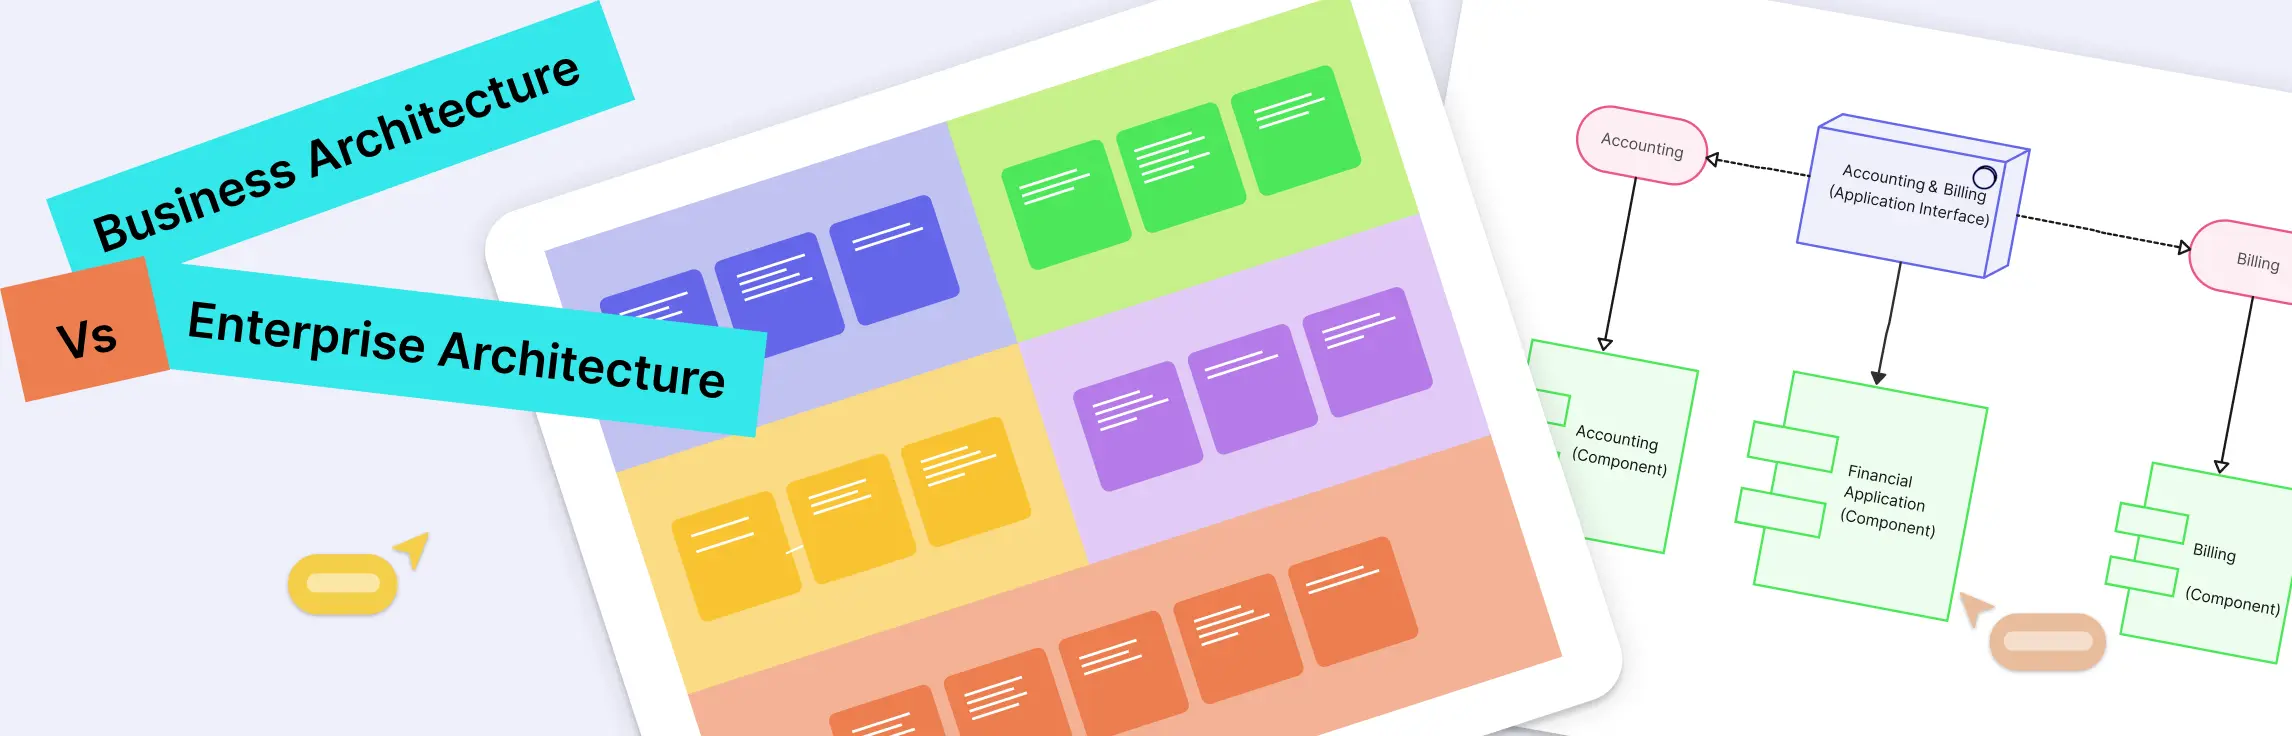
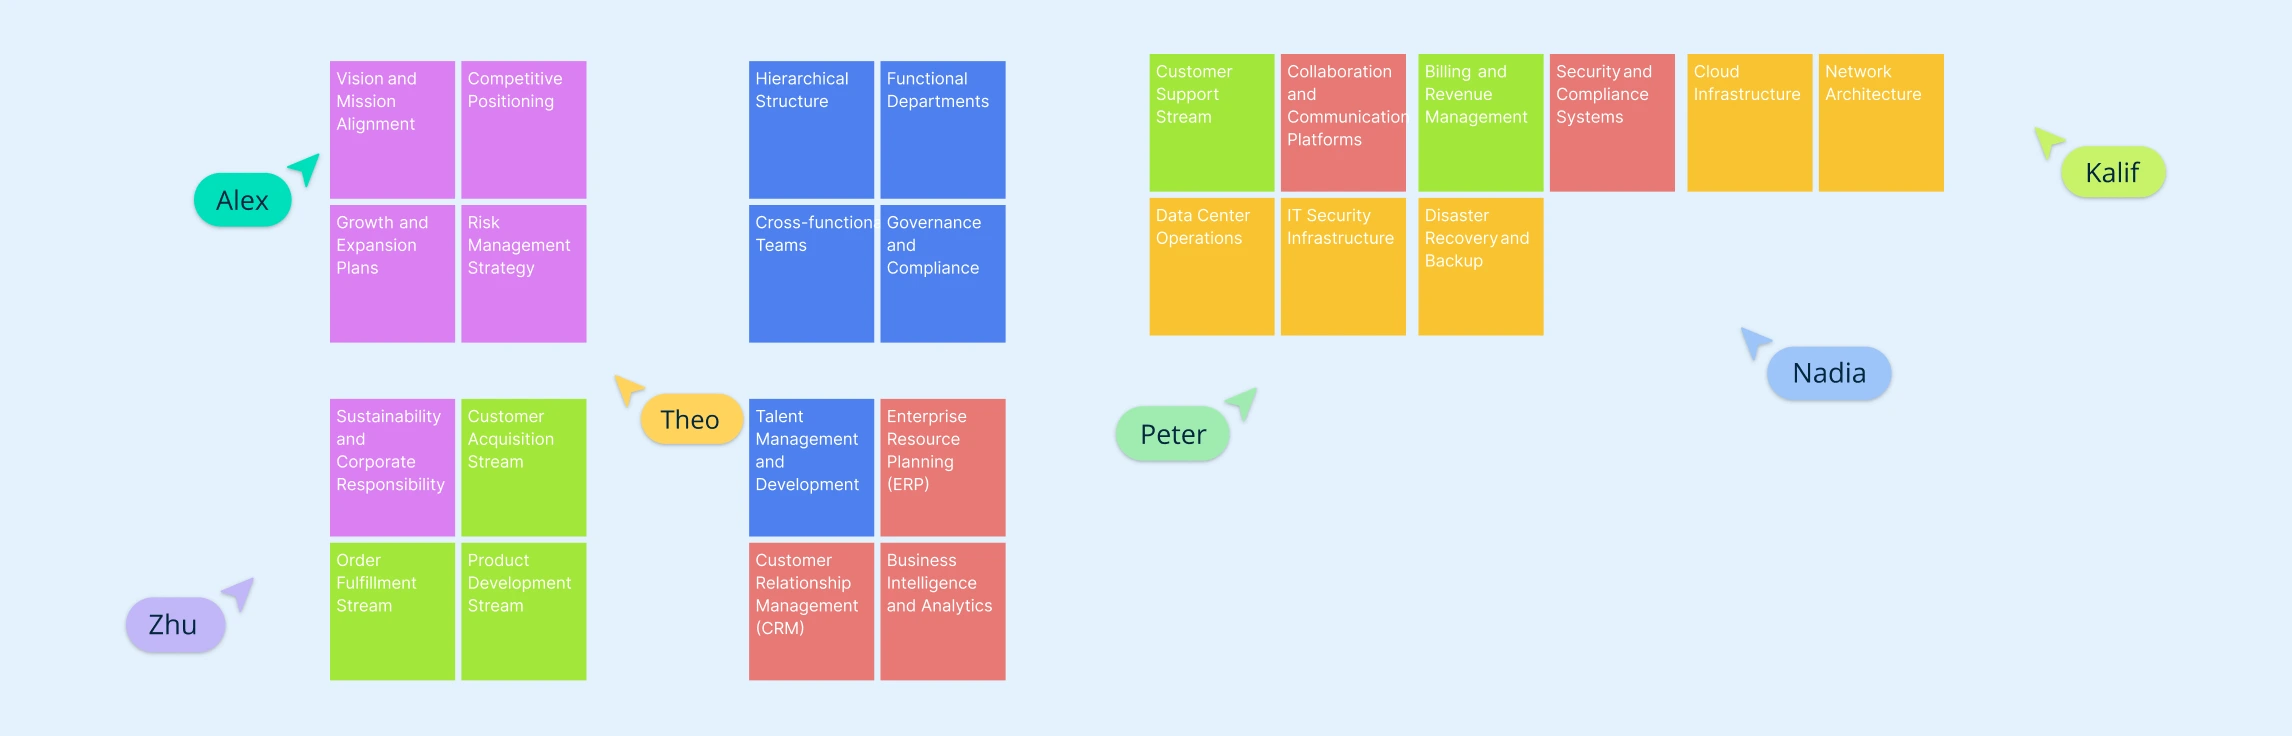
Business architecture maps what the business needs to do through capabilities, value streams, and operating context. Enterprise architecture coordinates business, data, application, and technology architectures to guide enterprise-wide change. Use business architecture when the main job is strategic alignment and capability design; use enterprise architecture when the main job is coordinating business and technology change across the organization.
In today’s fast-paced business environment, aligning strategy with execution is more critical than ever. Business architecture modelling provides a clear, structured view of an organization’s capabilities, processes, information flows, and stakeholders, helping leaders make informed decisions and drive operational excellence. Whether you’re a startup, an enterprise, or a growing e-commerce business, understanding and visualizing your business architecture can unlock clarity, efficiency, and strategic alignment, turning complex operations into actionable insights.
In this guide, we’ll explain what workflow mapping is, why it matters, and how to create one step by step, with examples and templates you can use to streamline processes like onboarding, content publishing, or purchase approvals.
Workflow diagrams make it easier to see how work gets done, who owns each step, and where delays or handoff issues appear. Whether you are managing a project, standardizing an operation, or improving a recurring process, a clear workflow diagram helps teams work from the same operating view instead of disconnected notes and assumptions. In this guide, we will walk through practical workflow diagram examples across different functions so you can adapt them to your own processes and improve how work moves across your team.
Ever feel like your organization’s strategy lives in one place, but execution happens somewhere completely different? Misaligned goals, unclear responsibilities, and disconnected processes can turn even the best strategies into missed opportunities.
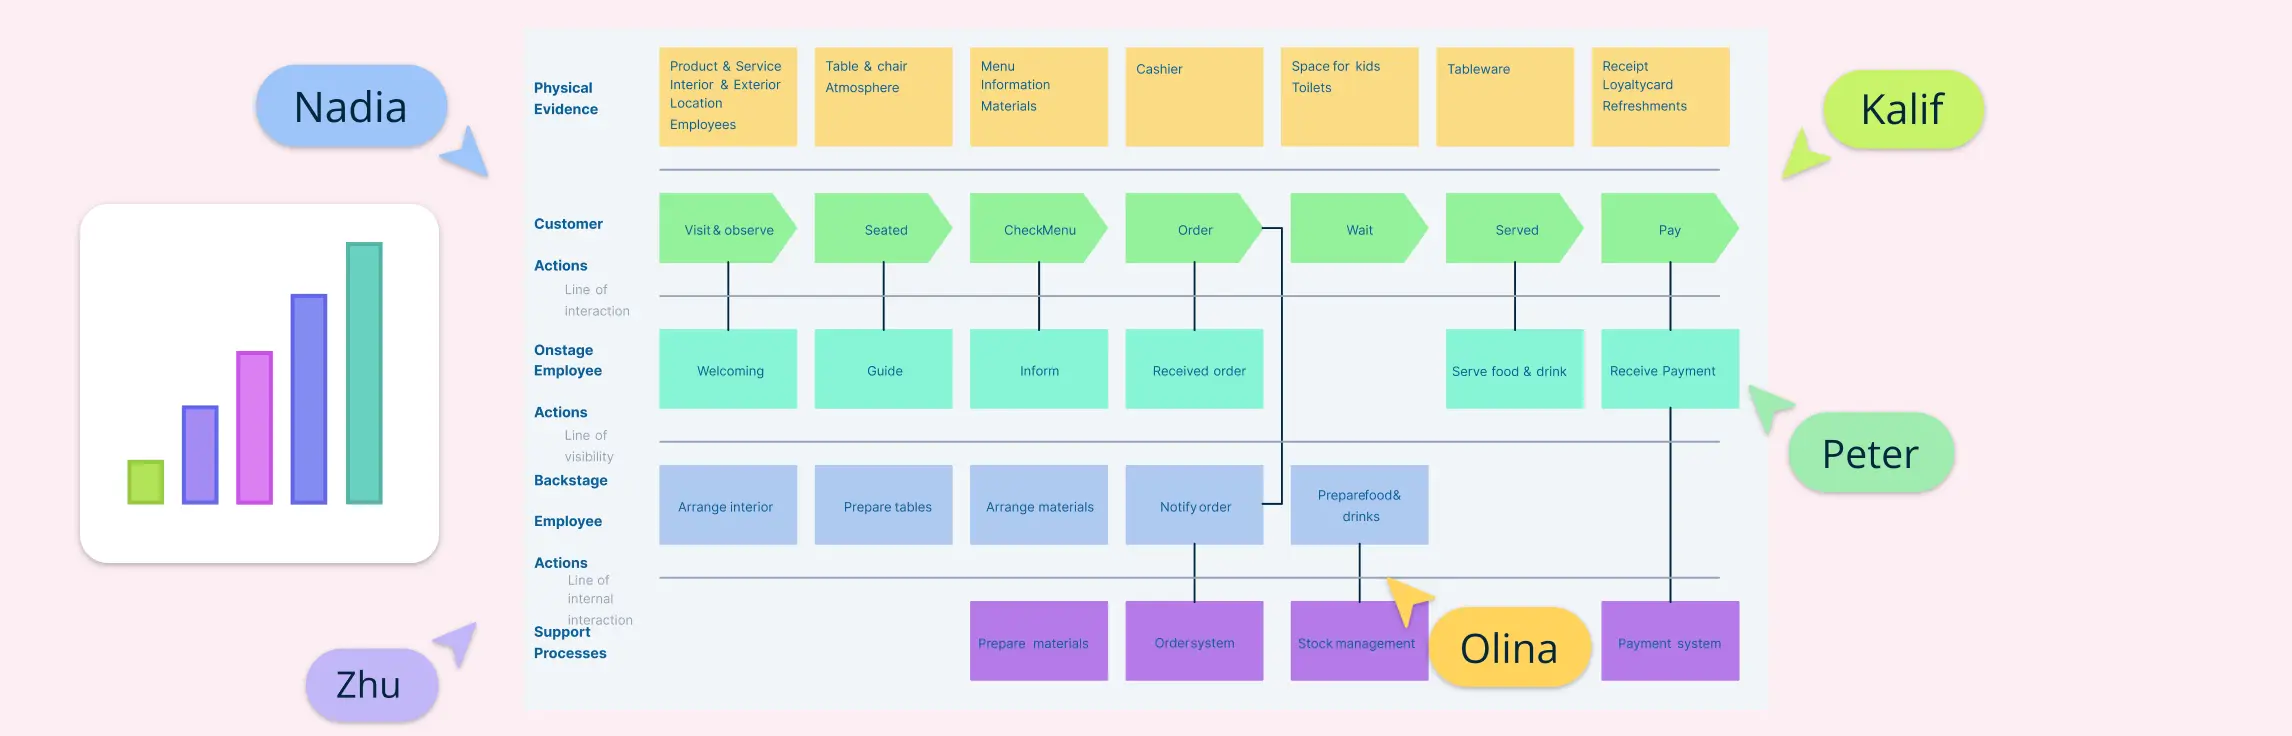
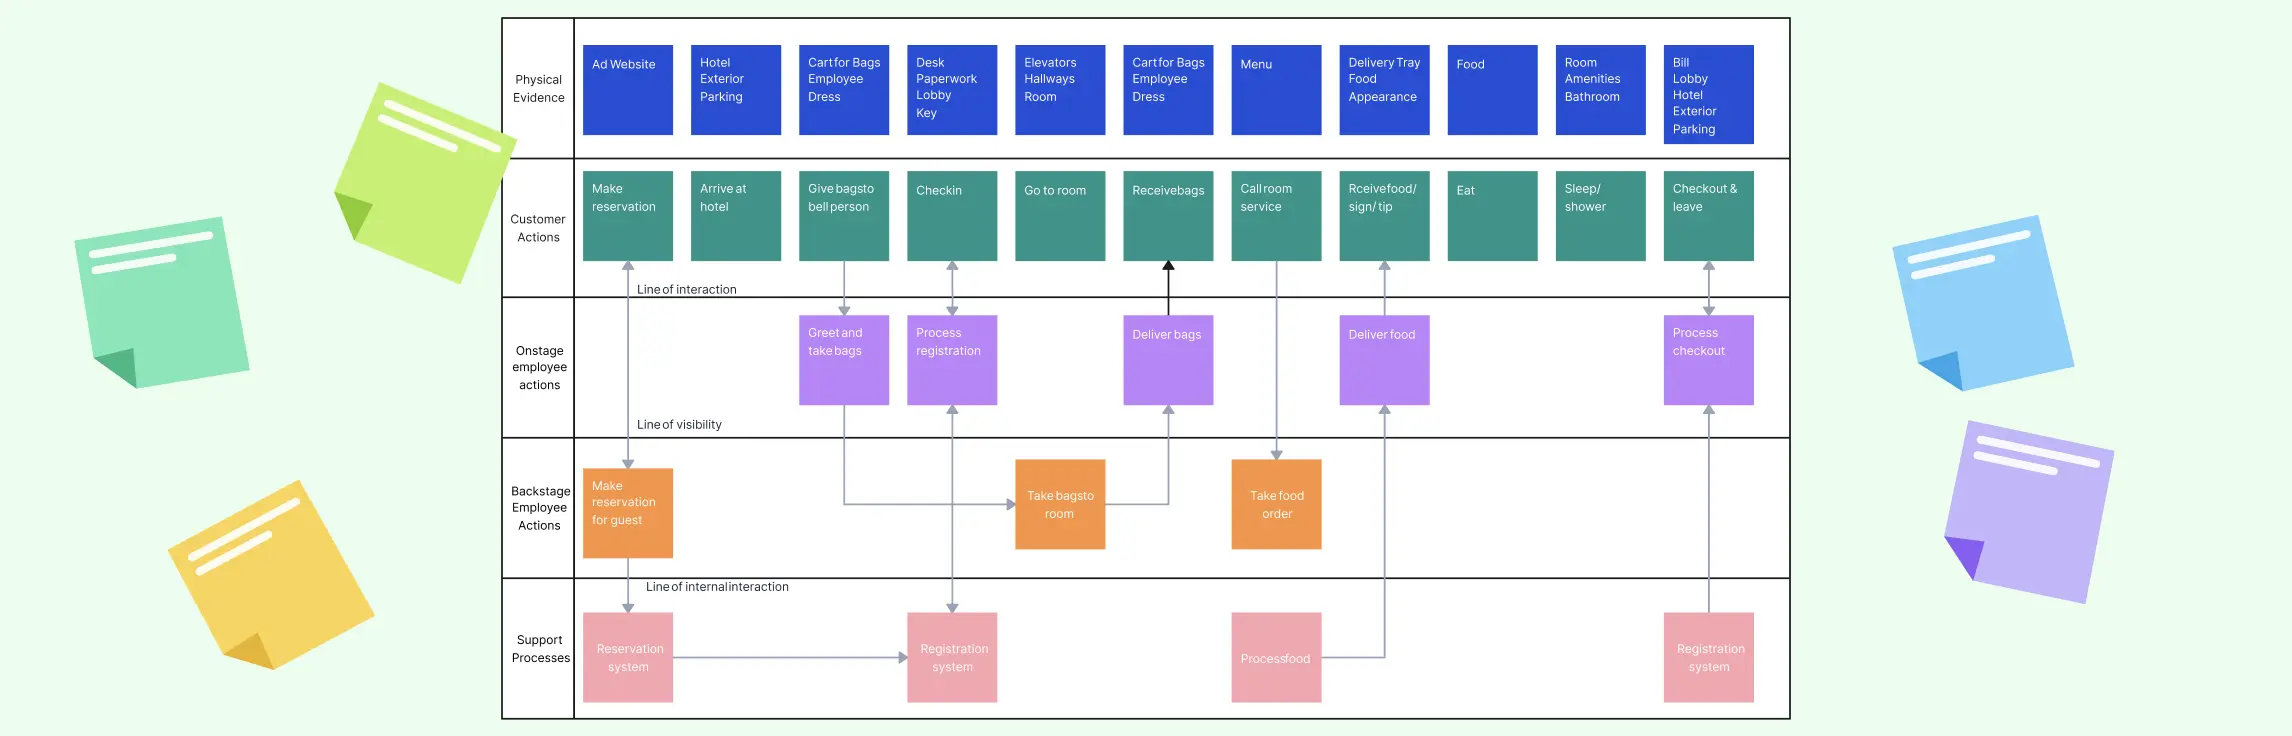
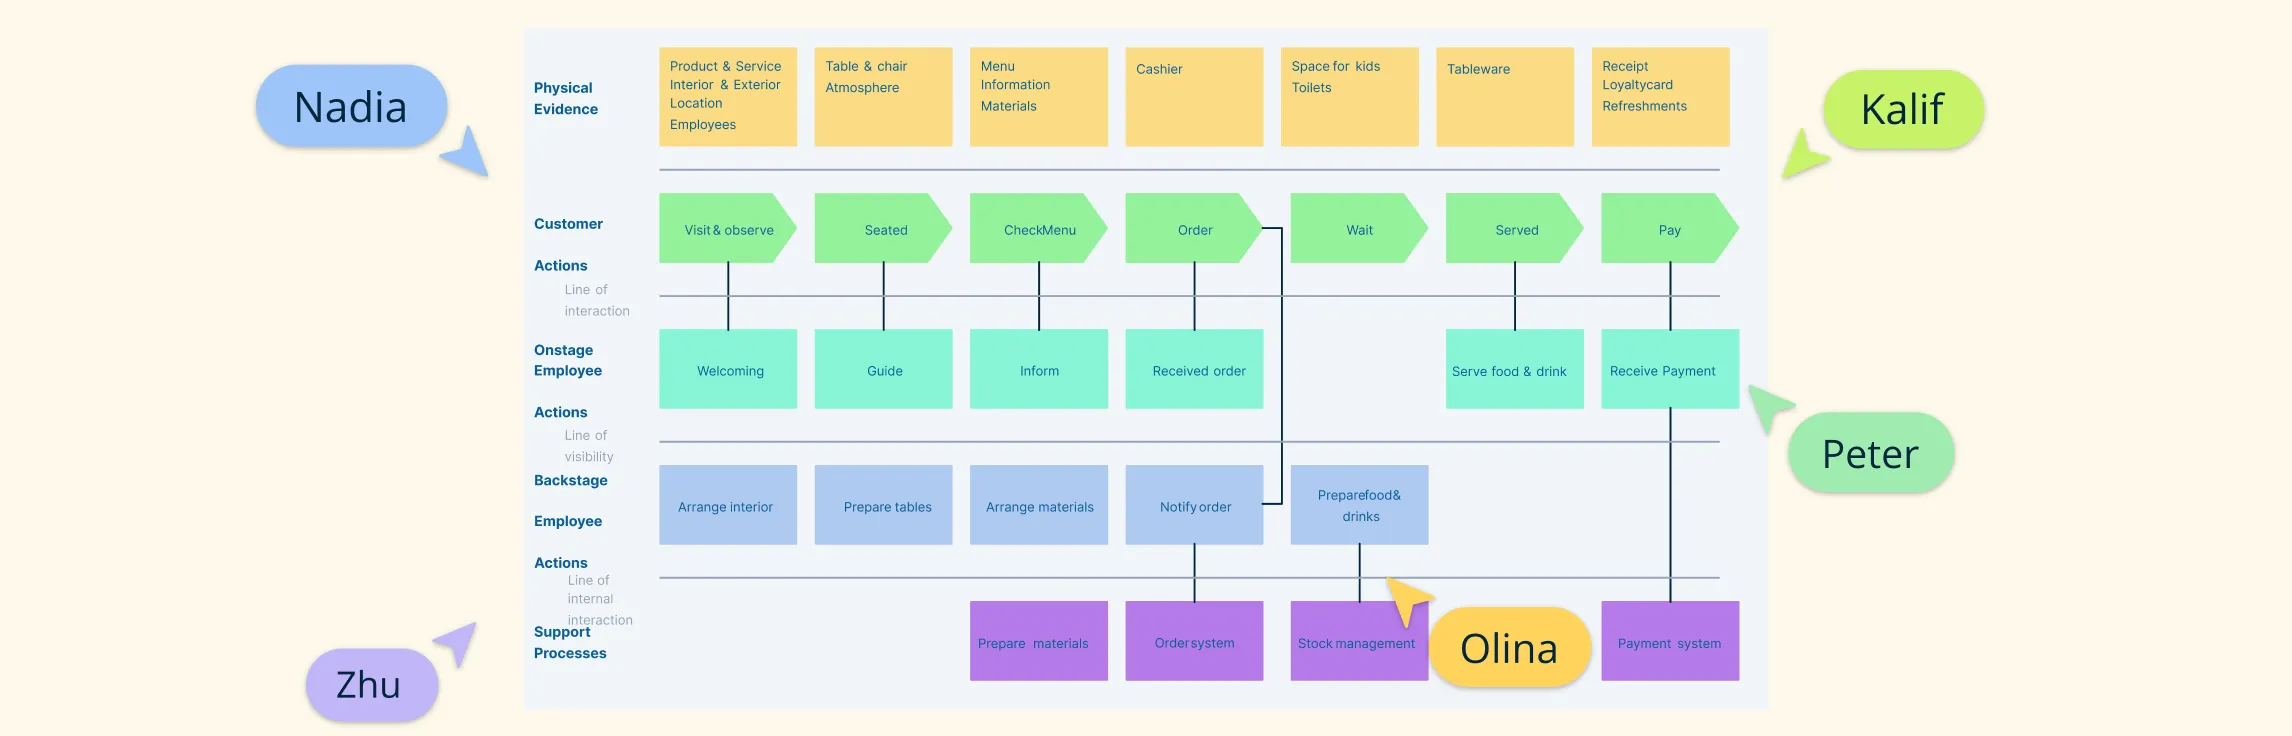
A service blueprint is a visual map that shows how a service works—from what the customer experiences to what happens behind the scenes. It helps teams see the full picture, align better, and improve how services are delivered.
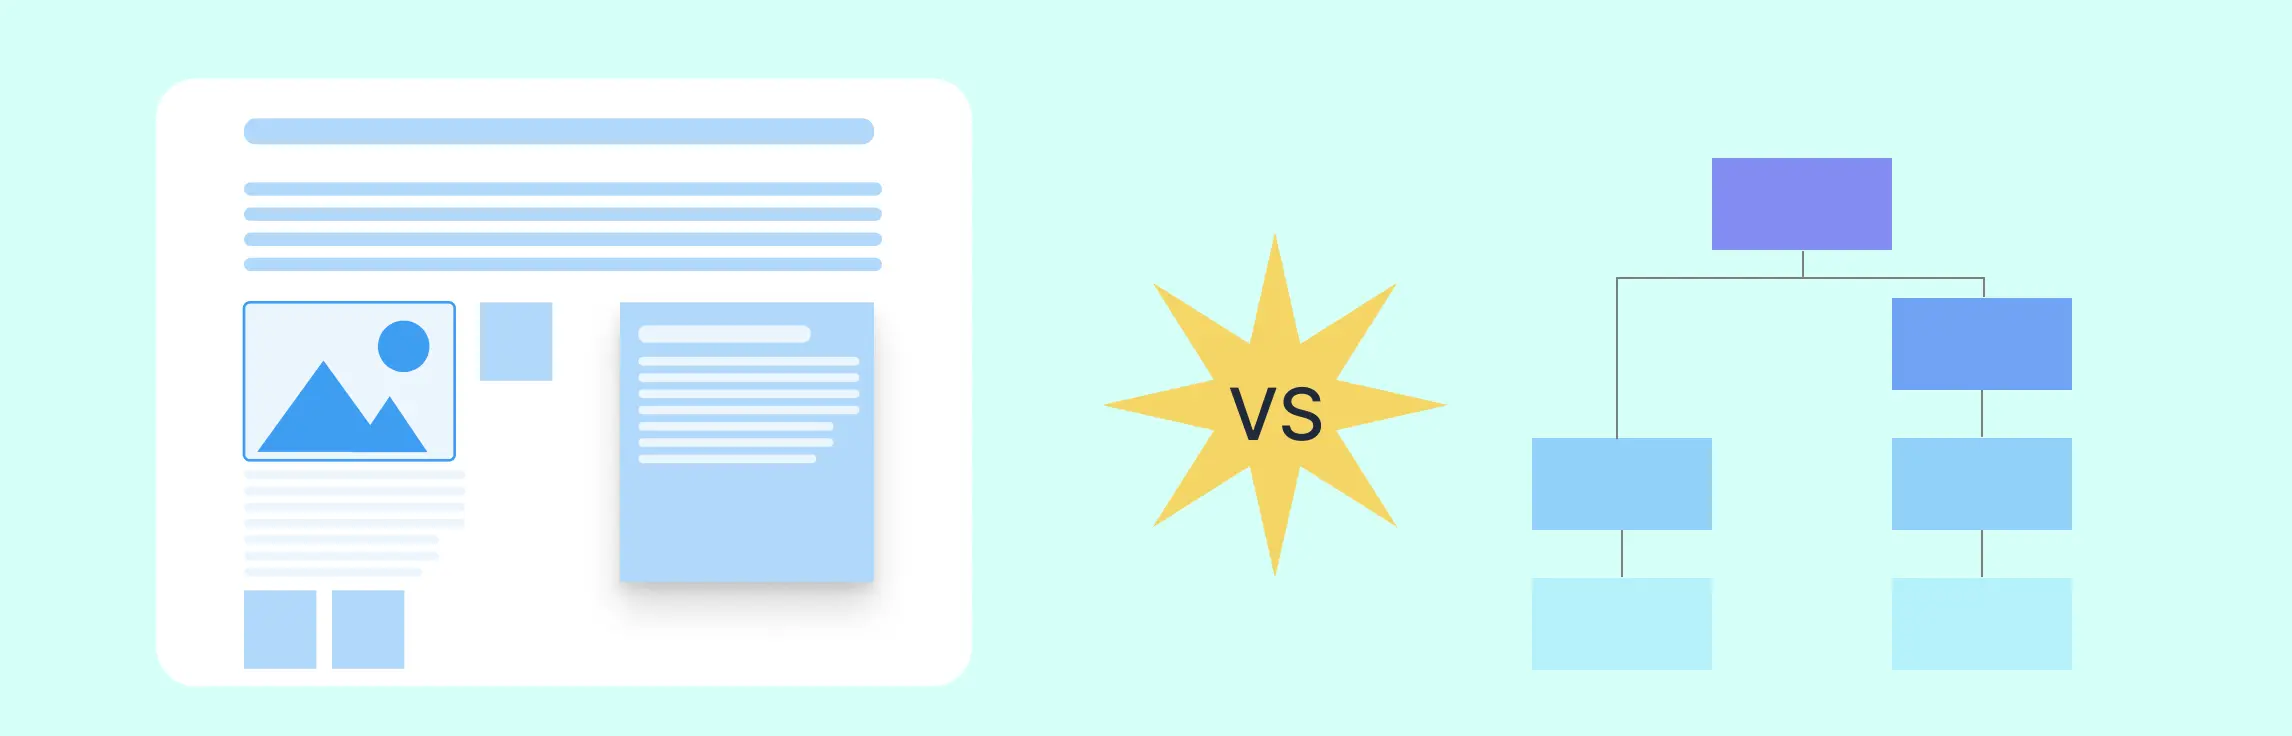
Visual tools like process maps and service blueprints help make sense of how businesses run and how services are delivered. They simplify complex workflows and highlight what’s working—and what’s not. While both are useful, service blueprint vs process map serve different goals. Knowing when to use each one can make your work more effective. In this guide, we’ll explain what process maps vs service blueprints are, how they differ, where they overlap, and when to use them—plus some real examples to help you get started.
The service blueprint methodology is a structured way to understand and improve how a service works—both for customers and the teams behind the scenes. Unlike a one-time diagram, it’s a repeatable process that helps businesses design better experiences, fix gaps, and align everyone involved in delivering a service.
Service blueprint software helps teams map both the customer-facing and behind-the-scenes parts of a service. It’s a key tool for improving experiences and operations. In this guide, we’ve rounded up the best service blueprint software available today — covering both free and paid options. Whether you’re looking for deep collaboration features, flexible templates, or just a simple way to visualize service processes, this list has you covered.
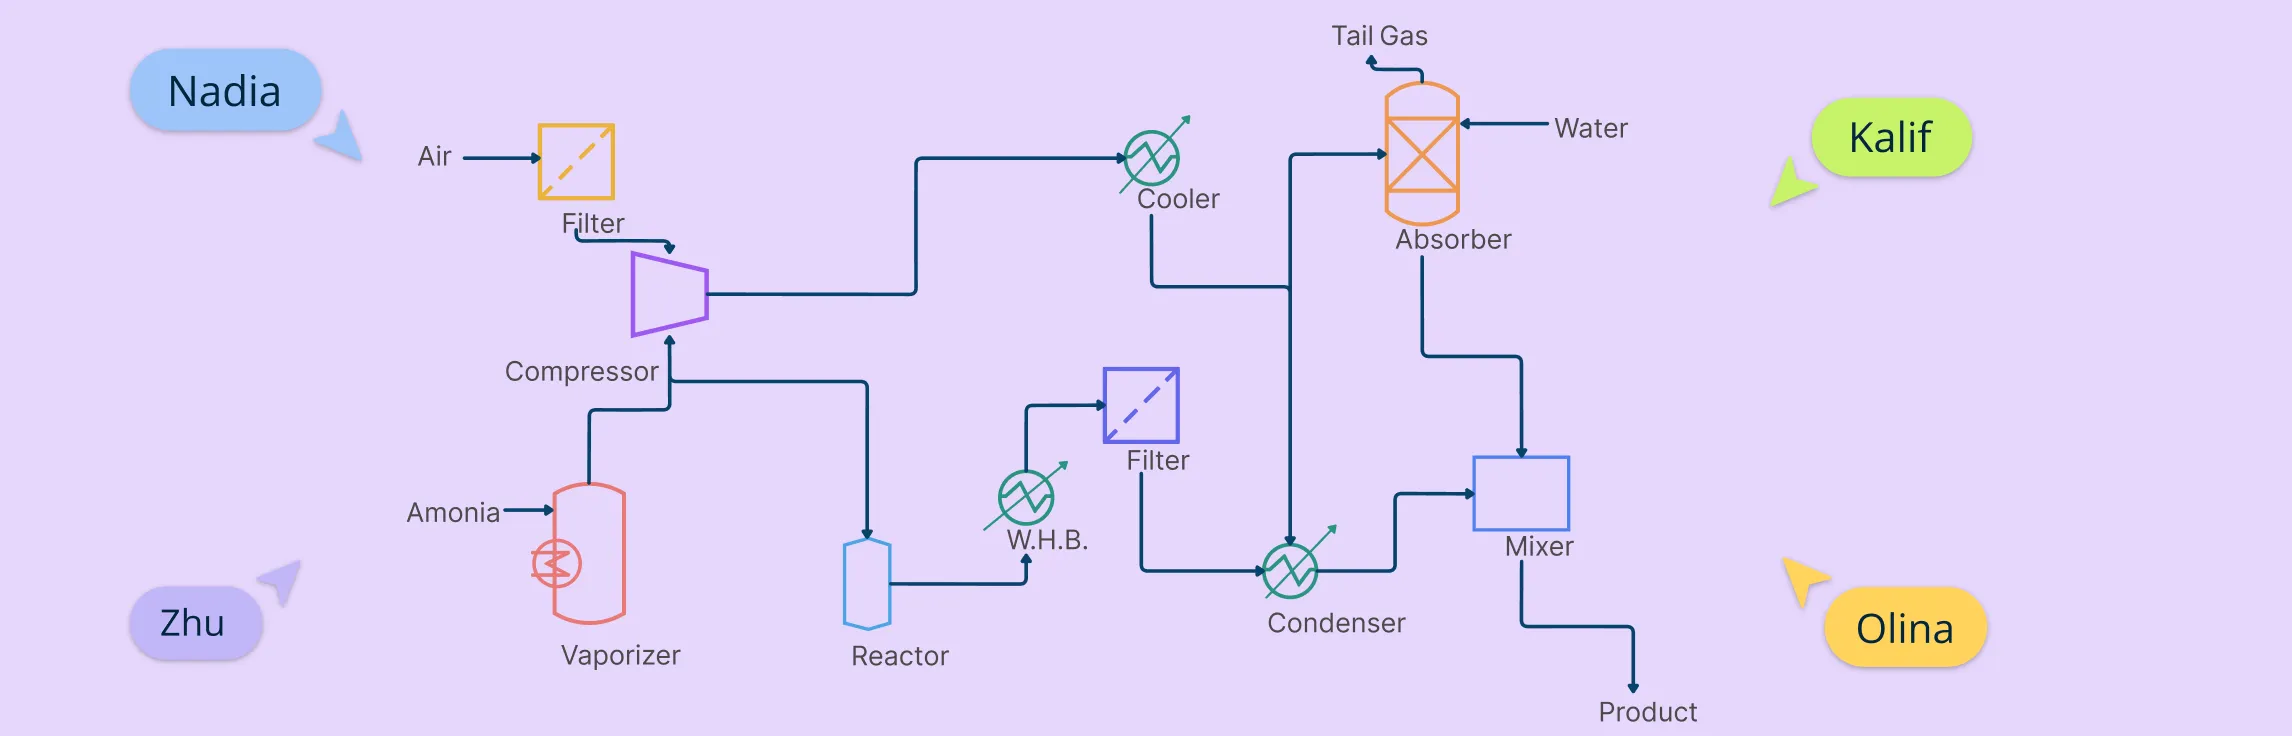
If you work in chemical, mechanical, or process engineering, chances are you’ve come across a process flow diagram (PFD). These aren’t your everyday business flowcharts—they’re high-level technical blueprints that show how materials and energy move through a system. In this guide, we’re going beyond the theory. You’ll learn how to create a process flow diagram, step by step.
What Is an Enterprise Capability Model An enterprise capability model is a structured, hierarchical representation of what an organization does, independent of how, where, or by whom the work is performed. It defines an organization’s capabilities—the core functions or outcomes it must deliver to succeed—without tying them to specific processes, systems, departments, or people.
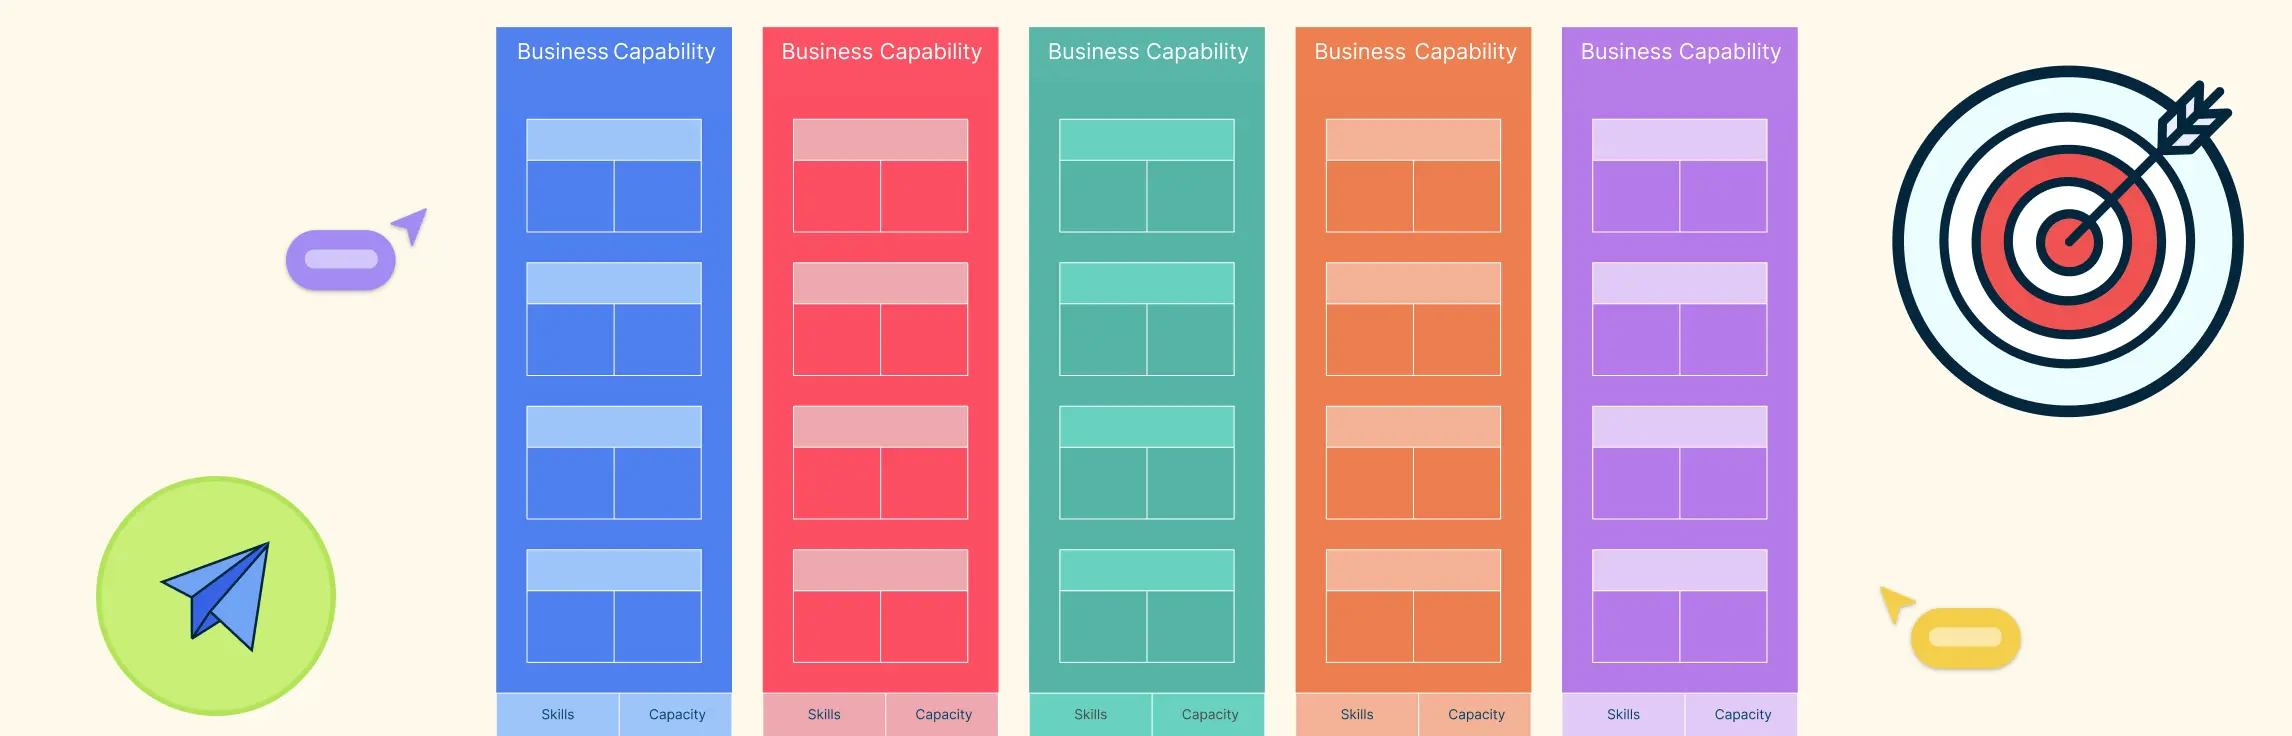
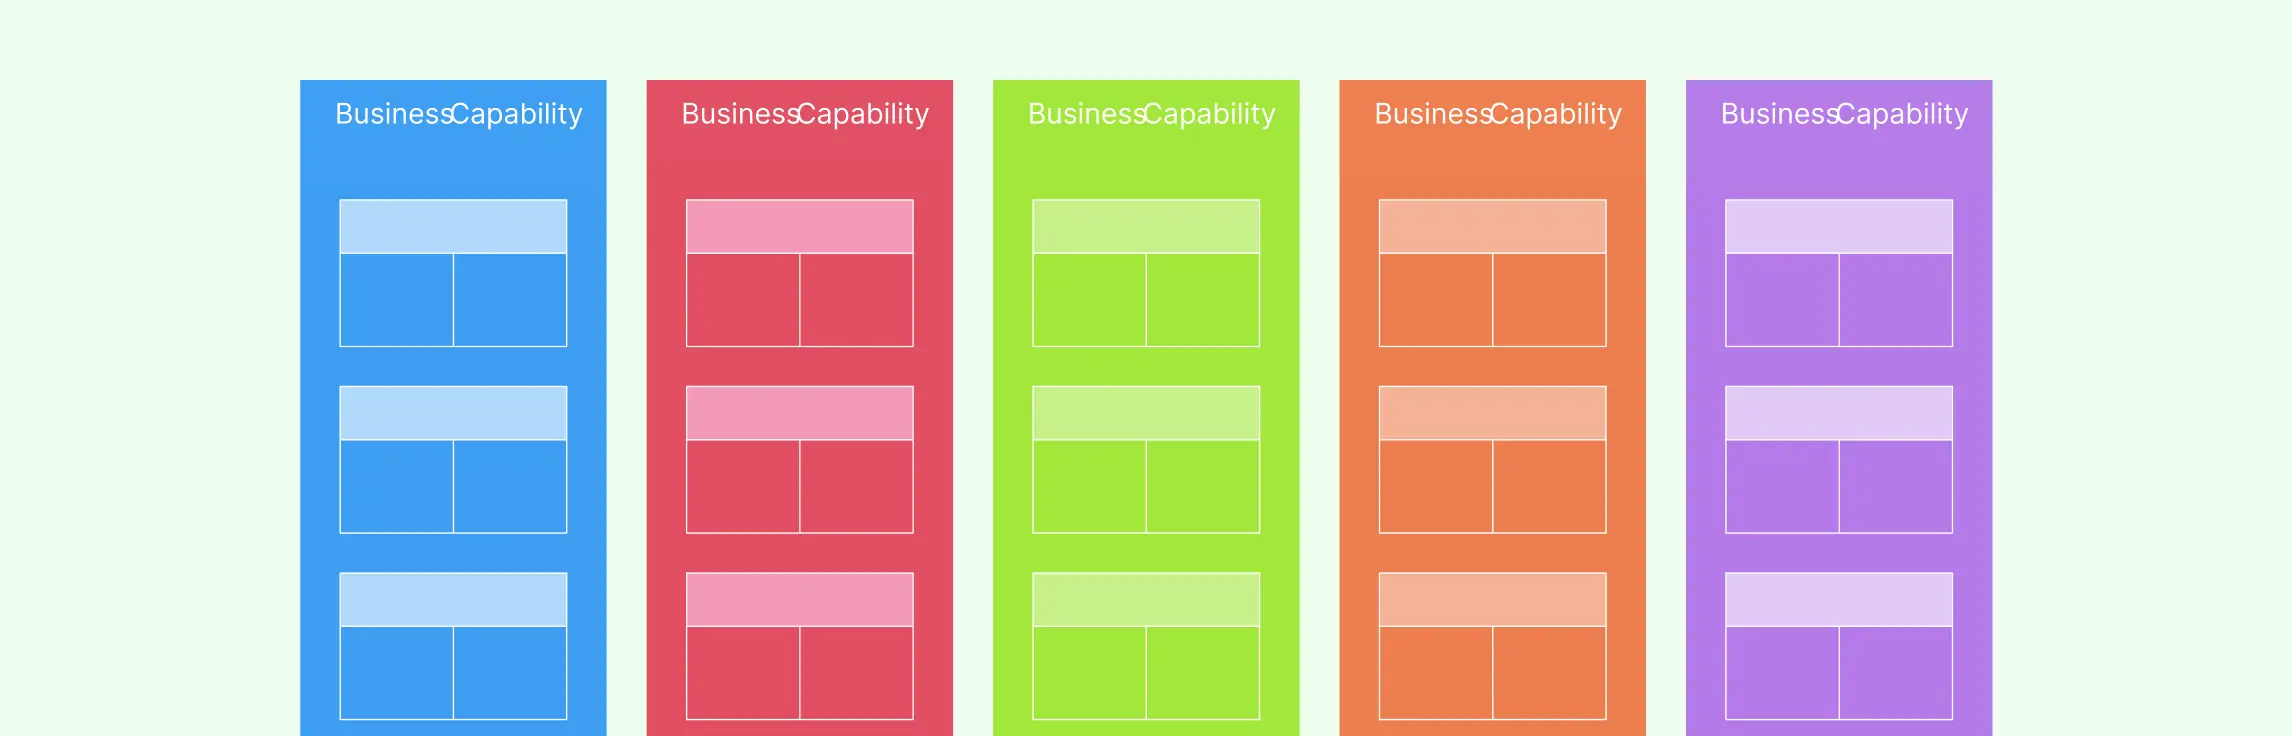
What Is a Business Capability Model? A business capability model is a visual representation of what a business does to deliver value, completely independent of how it’s done, who does it, or what systems are used.
A business capability map is a high-level view of what your organization does to deliver value, focusing on core areas like customer management, product development, or logistics. It strips away the complexity of roles and processes to highlight the actual capabilities that drive the business. In strategic management, capability maps help leaders see where the organization is strong, where it needs improvement, and where to invest. They provide a clear, shared view that connects strategy with real execution. Let’s see how to use business capability maps for strategic management.
In this guide, we’ll show you how to create a service blueprint step by step. Whether improving support, onboarding, or checkout, a blueprint helps you see the full picture—including behind-the-scenes processes. If you’re new to service blueprints, check out our what is a service blueprint guide first.
Creating a business capability map might sound complex, but it’s really about stepping back and taking a thoughtful look at what your business needs to be able to do — not how it does it or who does it. The goal is to create a big-picture view of your organization’s abilities so you can plan better, make smarter decisions, and stay aligned. Let’s see how to create a business capability map.
What Are Service Blueprints A service blueprint is a visual tool that shows how a service is delivered—from what the customer experiences to the behind-the-scenes processes that support it. It breaks down each step of the service, including what the customer does, what employees do (both seen and unseen), and the internal systems involved.
Service blueprints are powerful tools that help you visualize how your service works—from what the customer sees to the behind-the-scenes steps that make it happen. Whether you’re in hospitality, banking, healthcare, or education, a clear blueprint can reveal gaps, improve workflows, and create a better customer experience.
A business capability map is a visual representation that shows what an organization is able to do. It doesn’t focus on how the work gets done, who does it, or what tools are used. Instead, it outlines the core abilities that allow the business to operate, deliver value to customers, and achieve its goals. These abilities, called capabilities, are stable over time even when processes, people, or technologies change.
Process flow diagram software helps teams visualize how activities, decisions, information, materials, or systems connect. The term can refer to business process flows or to engineering process flow diagrams, so the best tool depends on the notation, symbols, data, and level of technical precision your use case requires.
A process flow diagram (PFD) visually maps out the steps in a process from start to finish using standard symbols. It helps teams understand, analyze, and improve workflows across fields like engineering, business, and software. This guide explains what a PFD is, its main components, key symbols, and why it’s useful.
A screen flow diagram is a visual tool that shows how users move through an app, website, or software. It maps out the different screens, the paths between them, and the decisions users make along the way. By laying out this journey step by step, teams can design smoother, more intuitive digital experiences.
Process Flow Diagram Symbols represent the key equipment, lines, and instruments in a process, helping you visualize how materials flow through a system. Knowing these standard PFD symbols makes reading and creating PFDs easier.
Have you ever felt lost in a complicated process at work or struggled to explain how something gets done? That’s where a workflow diagram comes in. It’s a simple, visual way to show the steps of a process from start to finish. By mapping out tasks, decisions, and who is responsible for what, workflow diagrams help teams work more efficiently and avoid confusion.
A system flowchart is a simple but powerful way to visualize how a process works. It breaks down complex systems into easy-to-follow steps using standard symbols and logical connections. Whether you’re designing a business workflow, developing software, or improving efficiency in an organization, a system flowchart helps you see the bigger picture.
Specification and Description Language (SDL) diagrams describe the structure and behavior of reactive, message-based systems. Defined by the ITU-T Z.100 series, SDL combines hierarchical system decomposition with communicating extended finite-state machines. This guide explains SDL meaning, core concepts and symbols, creation steps, applications, limitations, comparisons, and editable examples for telecommunications, software, and embedded-system work.
Flowcharts are one of the simplest yet most powerful tools for visualizing processes, making them easier to understand and optimize. In this guide on flowcharting basics, we’ll walk you through the essential symbols, best practices, and ready-to-use templates to help you create clear and effective flowcharts.
An Event-Driven Process Chain (EPC) diagram models the chronological and logical flow of a business process through events, functions, and AND, OR, or XOR connectors. It is especially useful when teams need to show what triggers an activity, what state results from it, and which role or system supports the work.
Every business, big or small, has a journey to turn ideas into products or services that customers love. But what makes this journey efficient and successful? The answer lies in understanding the value chain.
Projects rarely unfold in a linear, predictable manner. Like a complex chess match, each task interacts with others, creating a dynamic landscape of dependencies and potential challenges. Successful project managers don’t just manage tasks—they orchestrate intricate relationships, anticipating how one activity might impact another. Understanding these interconnections is less about rigid planning and more about creating flexible, adaptive strategies that can navigate the unpredictable terrain of project execution. Whether you’re leading a software development sprint, constructing a building, or launching a marketing campaign, mastering the art of mapping project dependencies can transform potential chaos into a synchronized, efficient workflow.
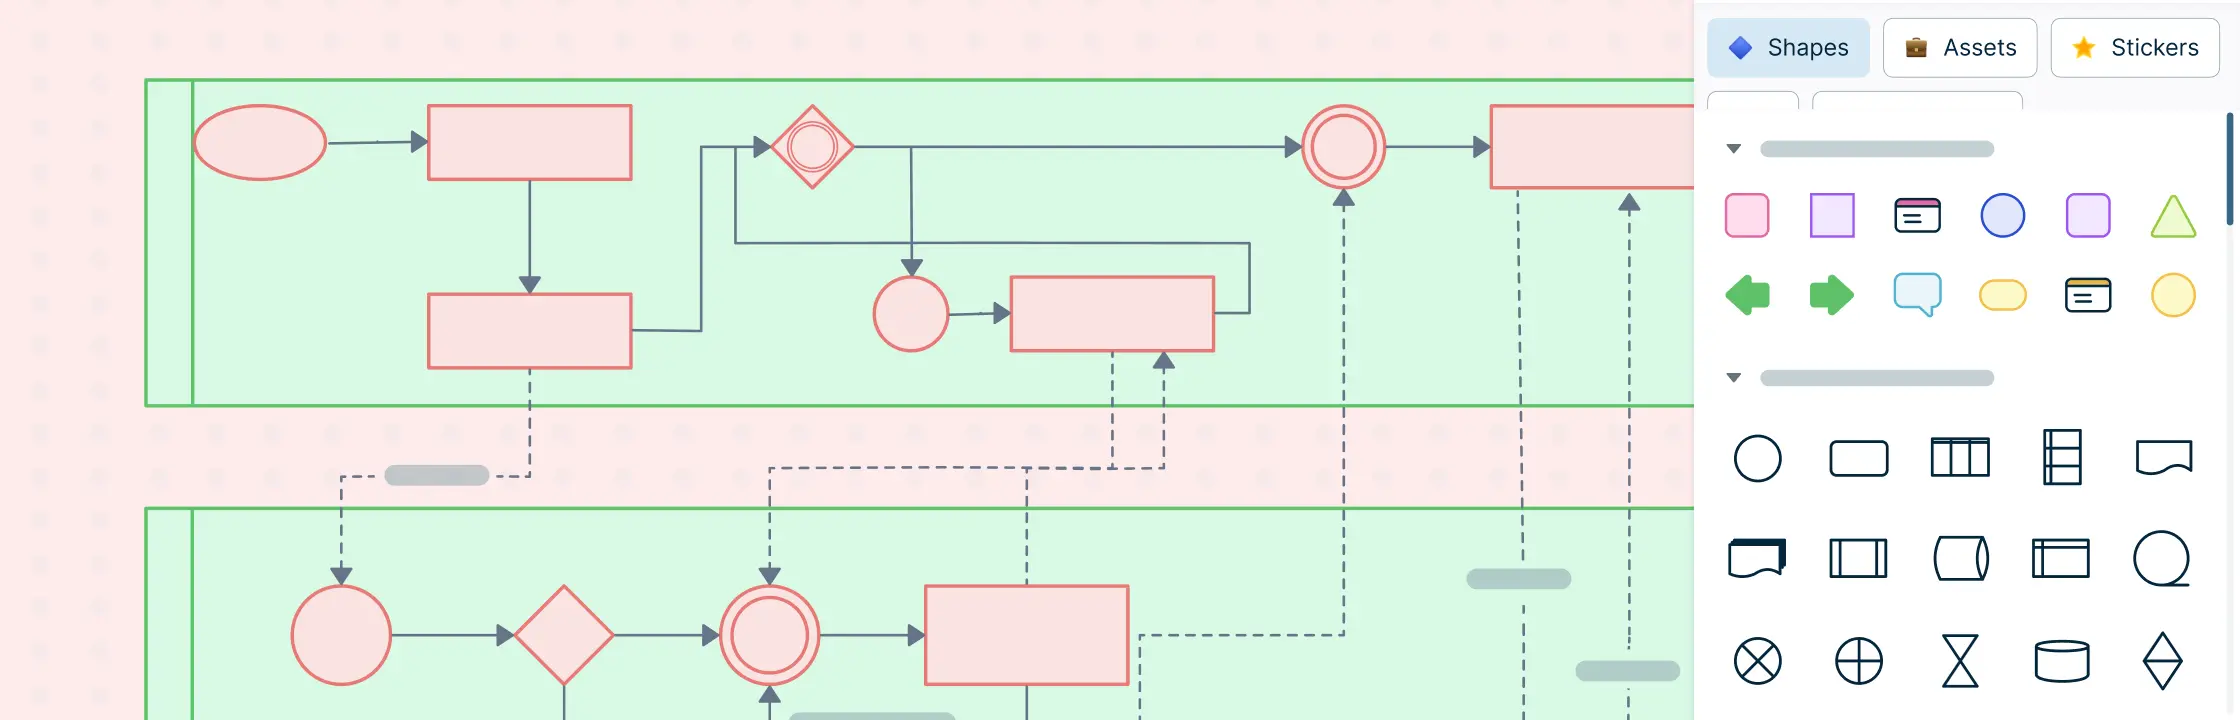
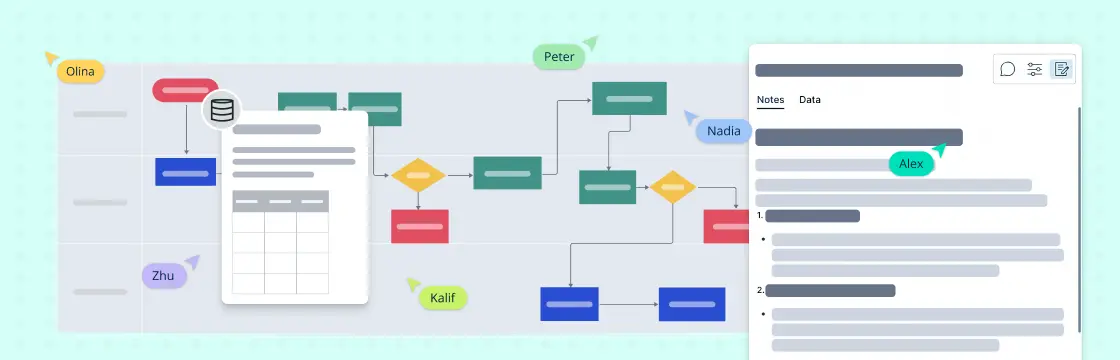
Swimlane diagrams are a visual tool that breaks down tasks by roles or departments, helping everyone involved understand their responsibilities and how they fit into the larger process. In this guide, we’ll cover everything you need to know about swimlane diagrams—from understanding their key components to learning how to create and use them effectively. Whether you’re new to process mapping or looking for a way to improve your workflow management, this guide will provide practical tips and examples to get you started.
Every business process has room for improvement. Whether it’s cutting down time, saving costs, or making things smoother for everyone involved, small changes can lead to big benefits. That’s where a process improvement plan comes in.
Creating an organizational chart might seem like a big task, but with tools like Google Sheets, it’s surprisingly easy. In this guide, we’ll walk you through every step of the process, from setting up your data to designing a chart that makes your hierarchy easy to understand. With just a few clicks, you’ll learn how to make an org chart in Google Sheets that’s clean, professional, and ready to share with your team.
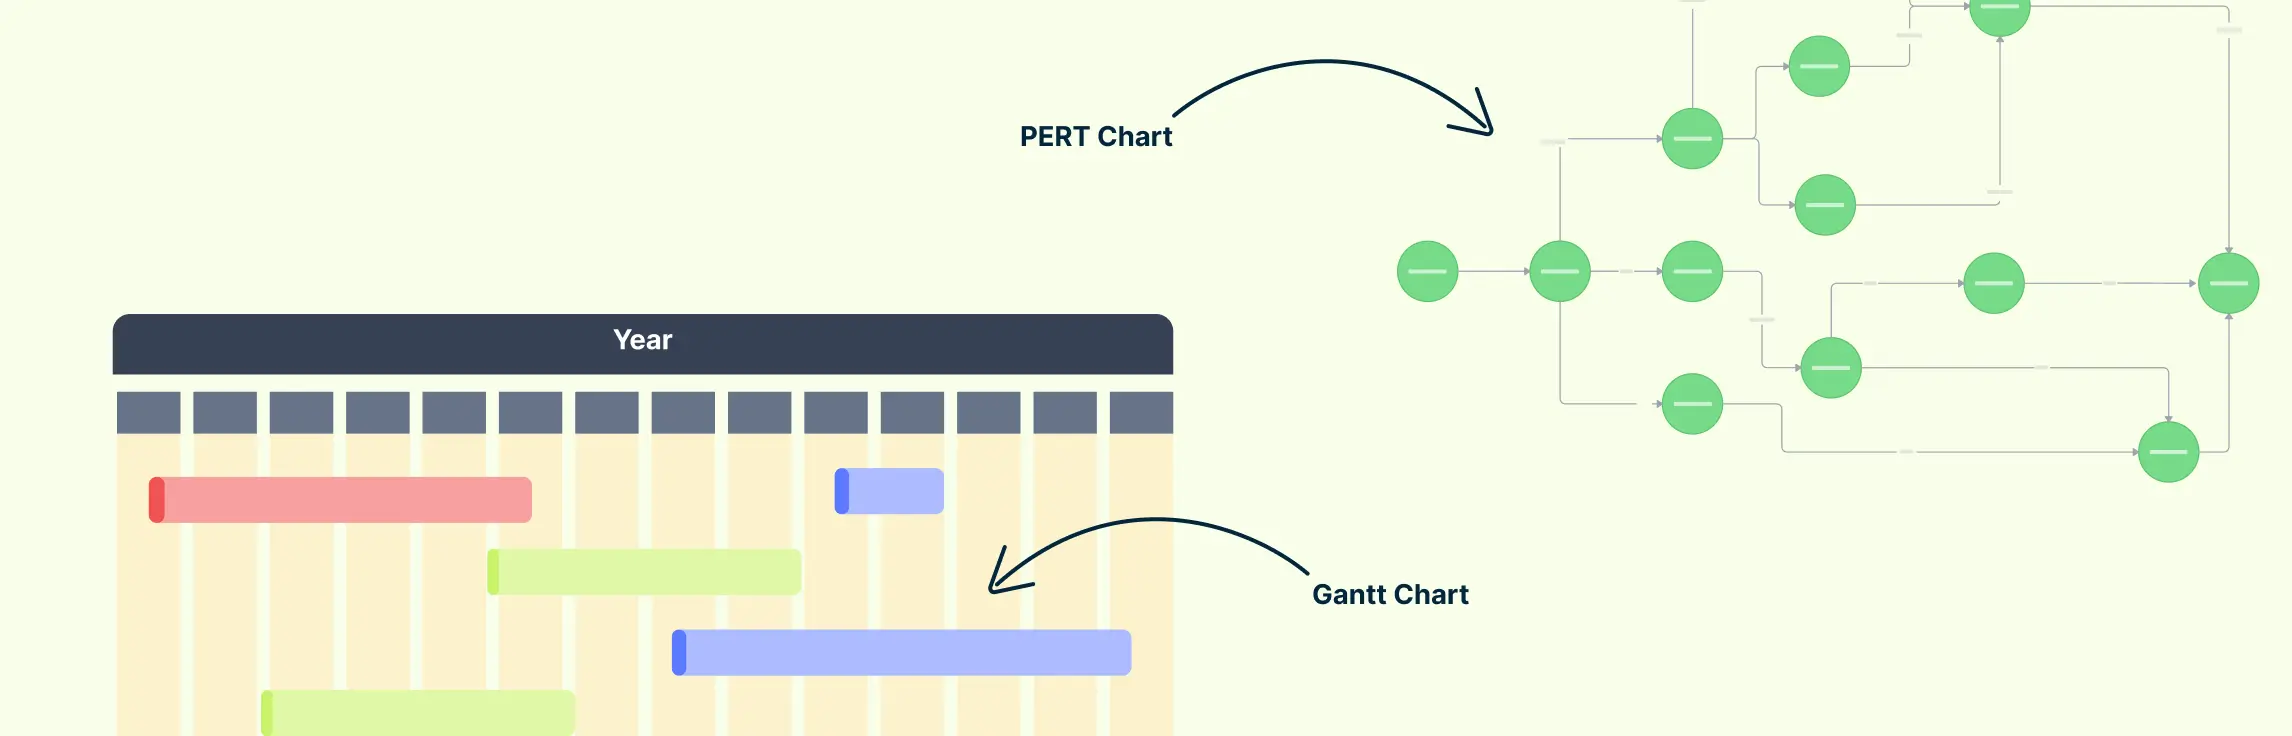
Overview of Project Management Charts In project management, PERT Chart vs Gantt Chart emerges as a key comparison for determining the most effective approach to task scheduling and resource allocation. Both tools are indispensable for visual collaboration and offer unique perspectives on project execution. However, their methodologies and applications vary significantly, making the PERT Chart vs Gantt Chart debate crucial for project managers.
Process mapping symbols are the visual building blocks used to map how work gets done. From simple tasks and decisions to complex workflows, the process map shapes help teams turn scattered steps into clear, easy-to-follow diagrams. In this guide, we’ll explore the most common process icons, what they mean, and how to use them effectively.
Business Process Modeling (BPM) is a critical practice for organizations striving to improve efficiency, streamline operations, and ensure continuous improvement across all departments. By providing a visual representation of business processes, BPM helps organizations understand how work flows, identify bottlenecks, and optimize processes for better performance.
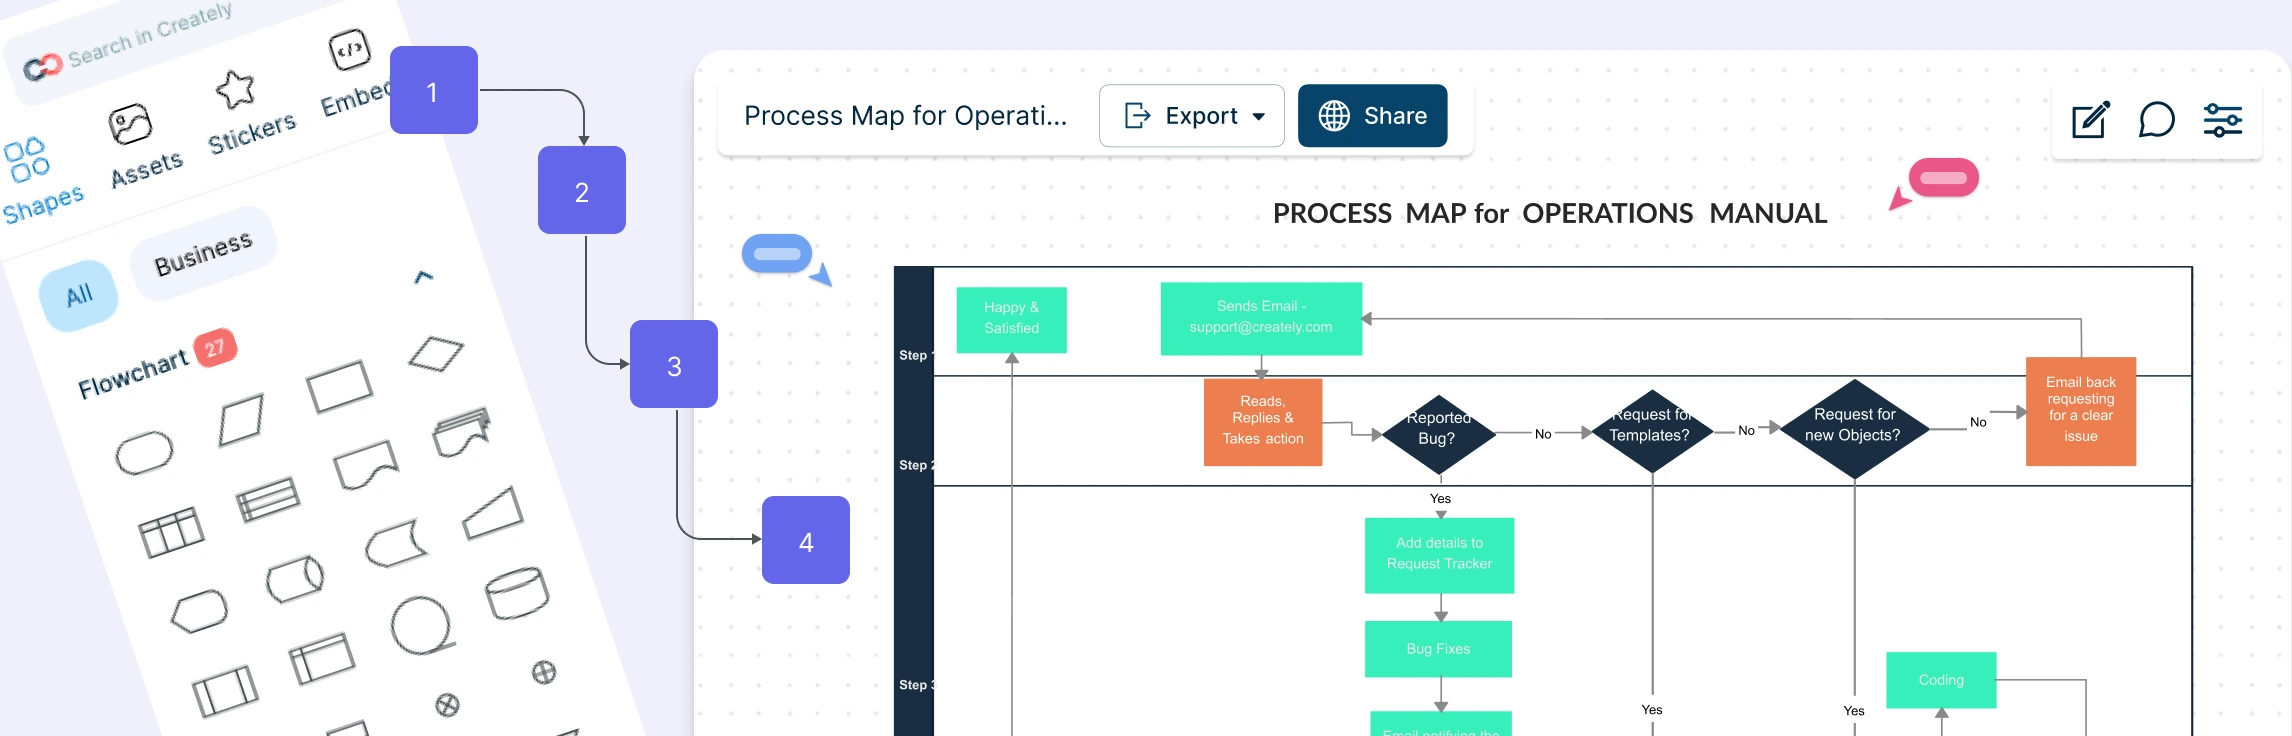
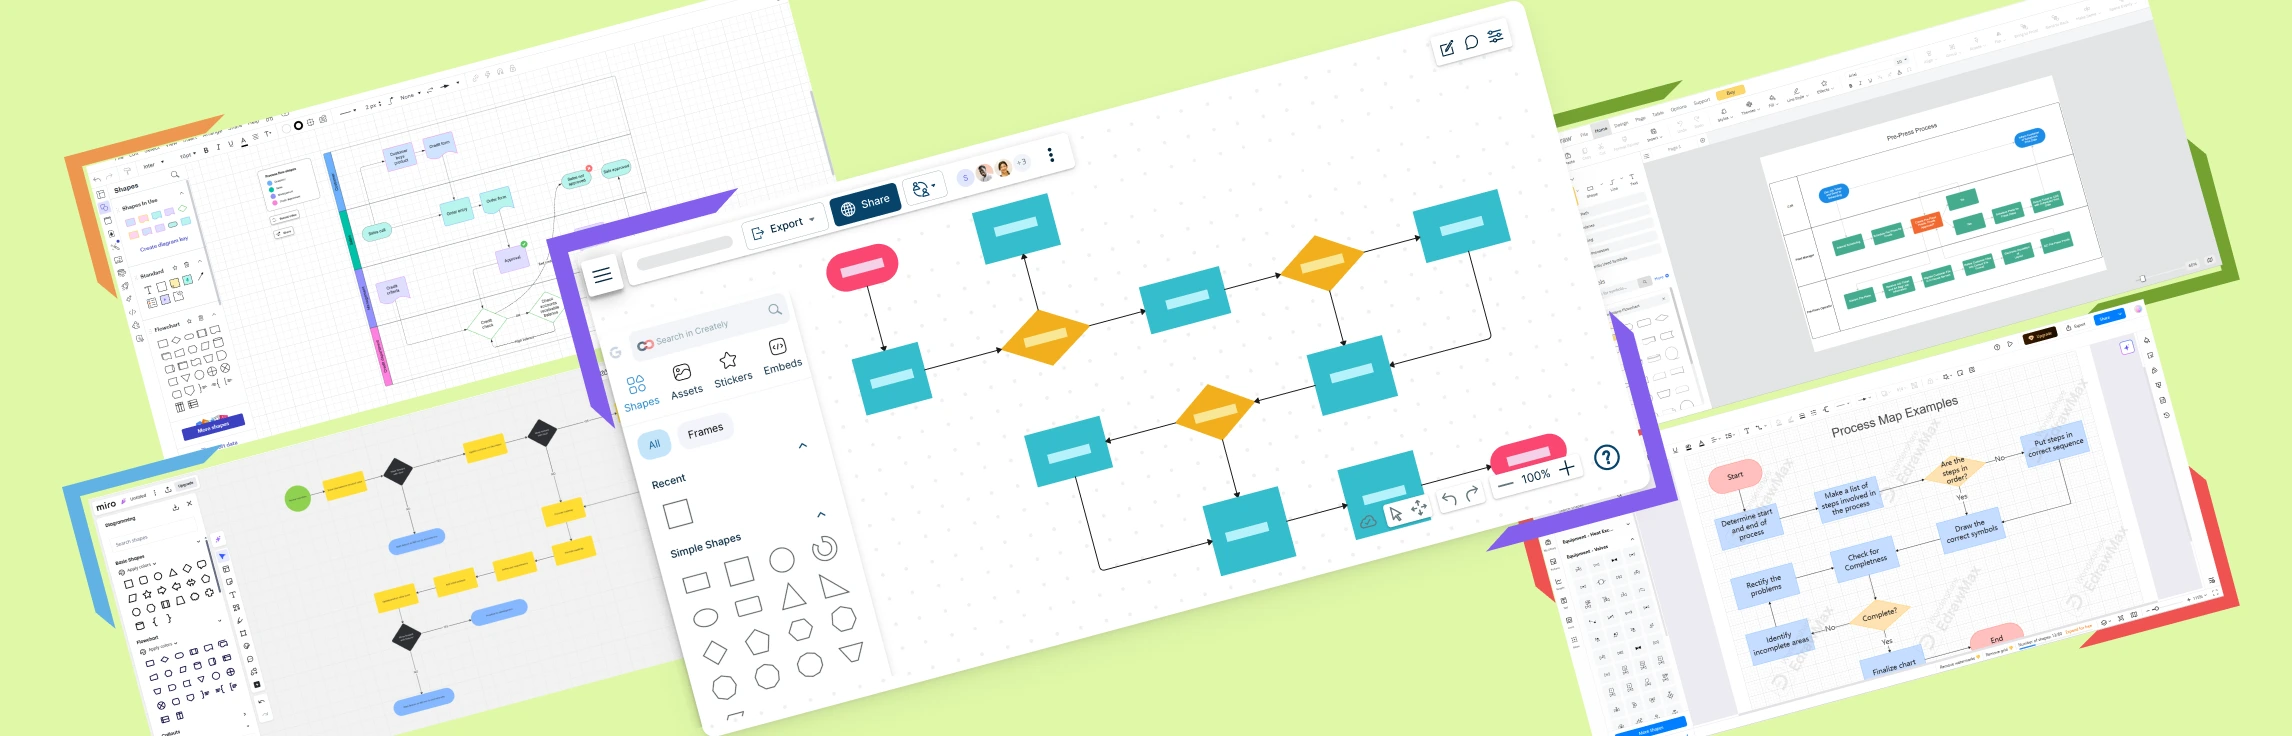
Process mapping software has become essential for businesses of all sizes because teams need more than a one-time diagram. They need a reliable way to map workflows, assign ownership, manage handoffs, and keep process documentation current as work changes. Without the right tool, process maps quickly become outdated, scattered, and hard to use during reviews or improvement work.
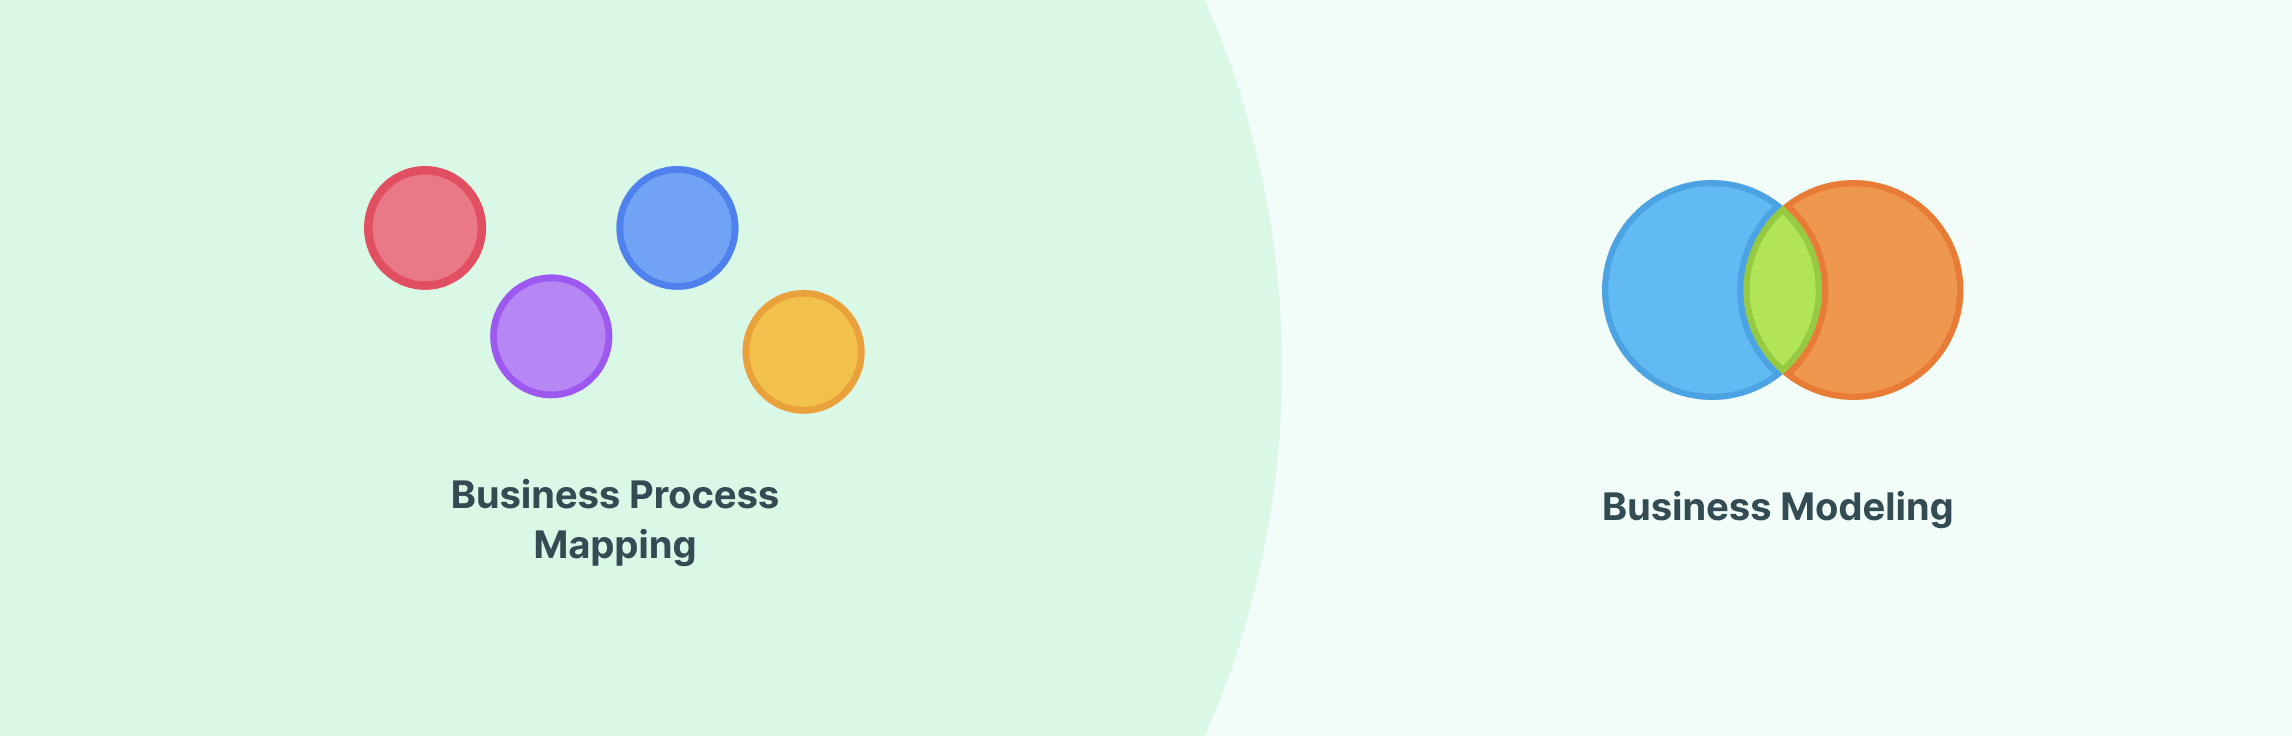
In today’s competitive business landscape, understanding the inner workings of your organization is essential. Business process mapping offers a powerful way to visualize, analyze, and improve every step in your organization’s workflows. From enhancing operational efficiency to ensuring compliance and improving communication, business process mapping provides a strategic advantage for businesses aiming to stay agile and productive. This guide covers the key benefits of business process mapping, showcases its versatility across industries, and demonstrates how Creately can amplify these benefits to take your business processes to the next level.
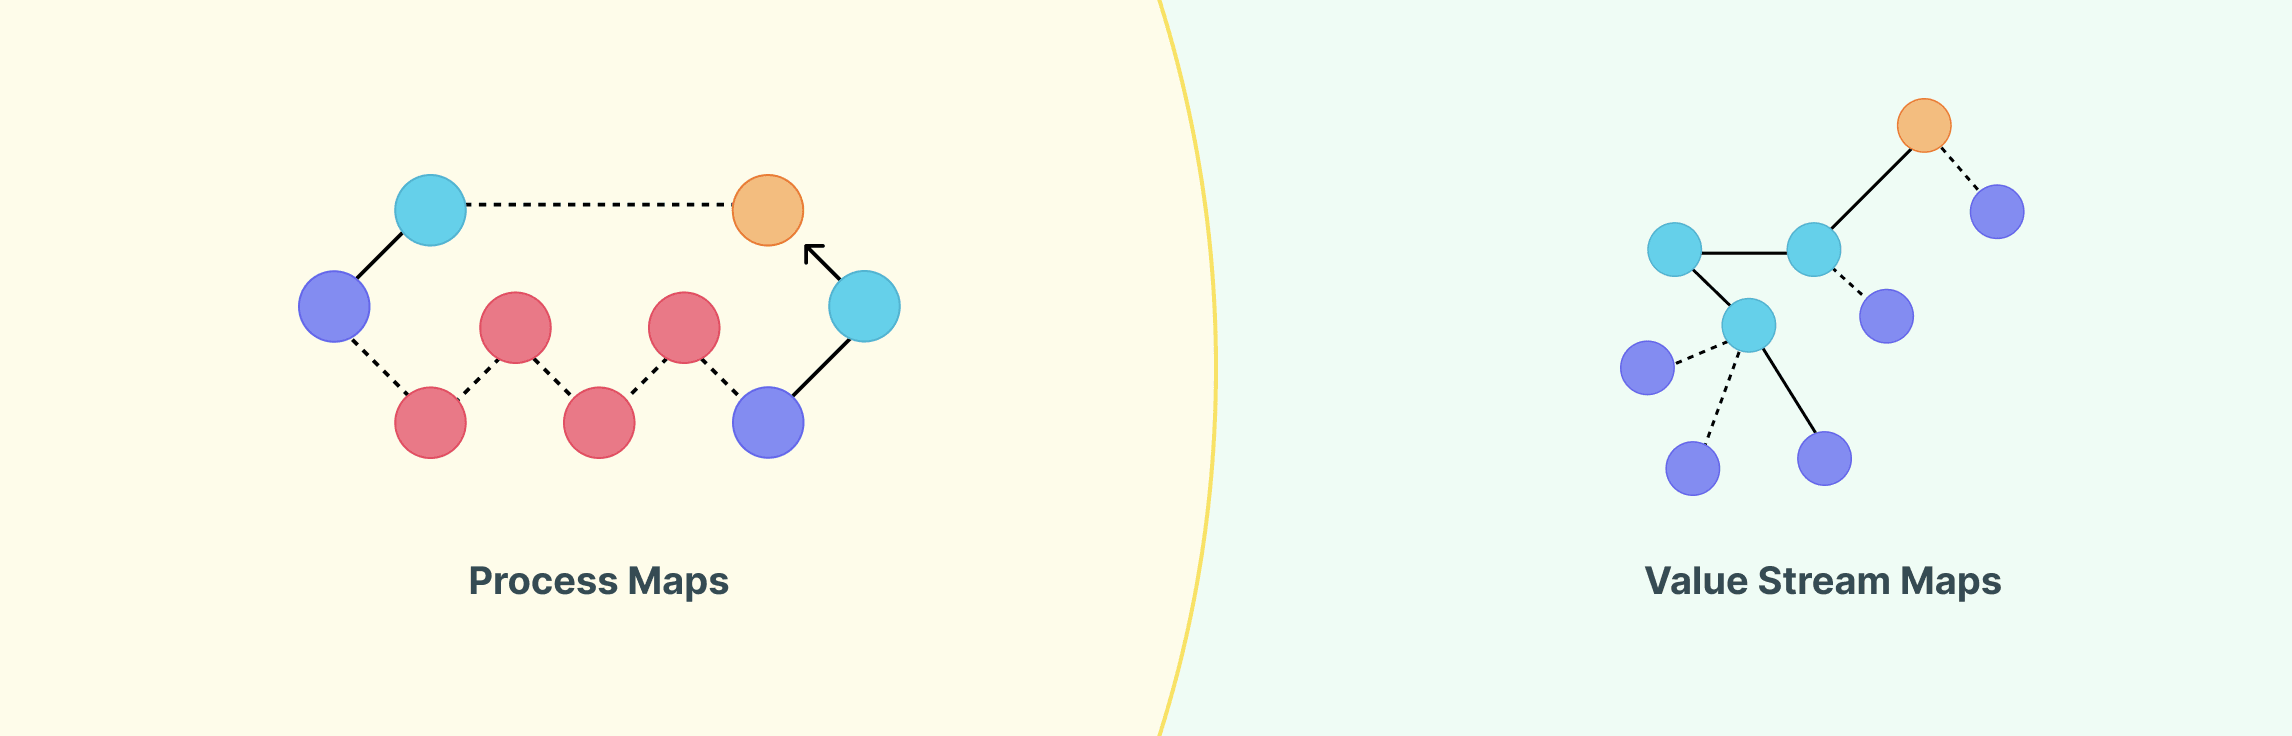
Understanding Process Map vs Value Stream Map Mapping is a critical component in business process management, directly influencing the efficiency and effectiveness of operations. Two frequently used mapping tools are the process map and the value stream map, each serving distinct purposes.
Defining Business Processes Business processes are the structured activities or tasks implemented within an organization to produce a specific service or product. At their core, they are the backbone of organizational operations, impacting everything from workflow efficiency to product quality. Understanding these processes is pivotal as it paves the way for systematic improvements and resource optimization.
What are Process Maps? Process maps are essential tools used across various industries to visualize workflows, enabling teams to gain a comprehensive understanding of processes. They serve as visual guides that detail every step, decision point, and interaction within a process. By illustrating how tasks are connected, process maps help identify inefficiencies, streamline procedures, and enhance team collaboration.
Business process mapping is a way to visualize and understand how a business works step-by-step, making it easier to spot inefficiencies and improve workflows. By creating a clear picture of each task, role, and decision point, it helps teams see where they can save time, cut costs, reduce errors, and keep supporting process knowledge connected to the map. This guide introduces the essentials of business process mapping, from understanding map types to learning best practices and tackling common challenges.
In the complex world of healthcare, effective communication and streamlined processes are essential for delivering high-quality patient care. Process mapping serves as a powerful tool that allows healthcare professionals to visualize workflows, identify inefficiencies, and enhance collaboration among teams. This guide aims to provide a comprehensive overview of process mapping in healthcare, exploring its benefits, step-by-step creation techniques, various types of process maps, and best practices for success. Whether you’re looking to improve patient journeys, track clinical pathways, or eliminate waste in your operations, this guide will equip you with the knowledge and tools necessary to foster efficiency and quality in your healthcare organization.
Logistics process mapping visually documents how goods, information, decisions, and responsibilities move through activities such as procurement, receiving, warehousing, fulfillment, transportation, delivery, and returns. It gives logistics teams a shared view for validating the current process, identifying weak handoffs and delays, and designing a measurable future state.
Process mapping is a powerful tool that helps businesses visualize and improve their workflows. By creating a clear map of each step in a process, teams can see how work flows, identify bottlenecks, and pinpoint opportunities to make things run smoother. But there isn’t just one way to map a process—different process mapping techniques are available, each suited to various types of tasks and levels of detail.
Business process mapping often fails for one simple reason: teams either create maps that are too high-level to improve day-to-day work or too detailed to maintain as processes change. This guide explains business process mapping levels you can use to document the same workflow at the right depth for the right user. You’ll learn the 4 core levels (plus an optional Level 5 for work-instruction detail), see practical examples for each level, compare using 4 vs. 5 levels, and understand how to choose the right level for goals like alignment, improvement, training, compliance, and automation.
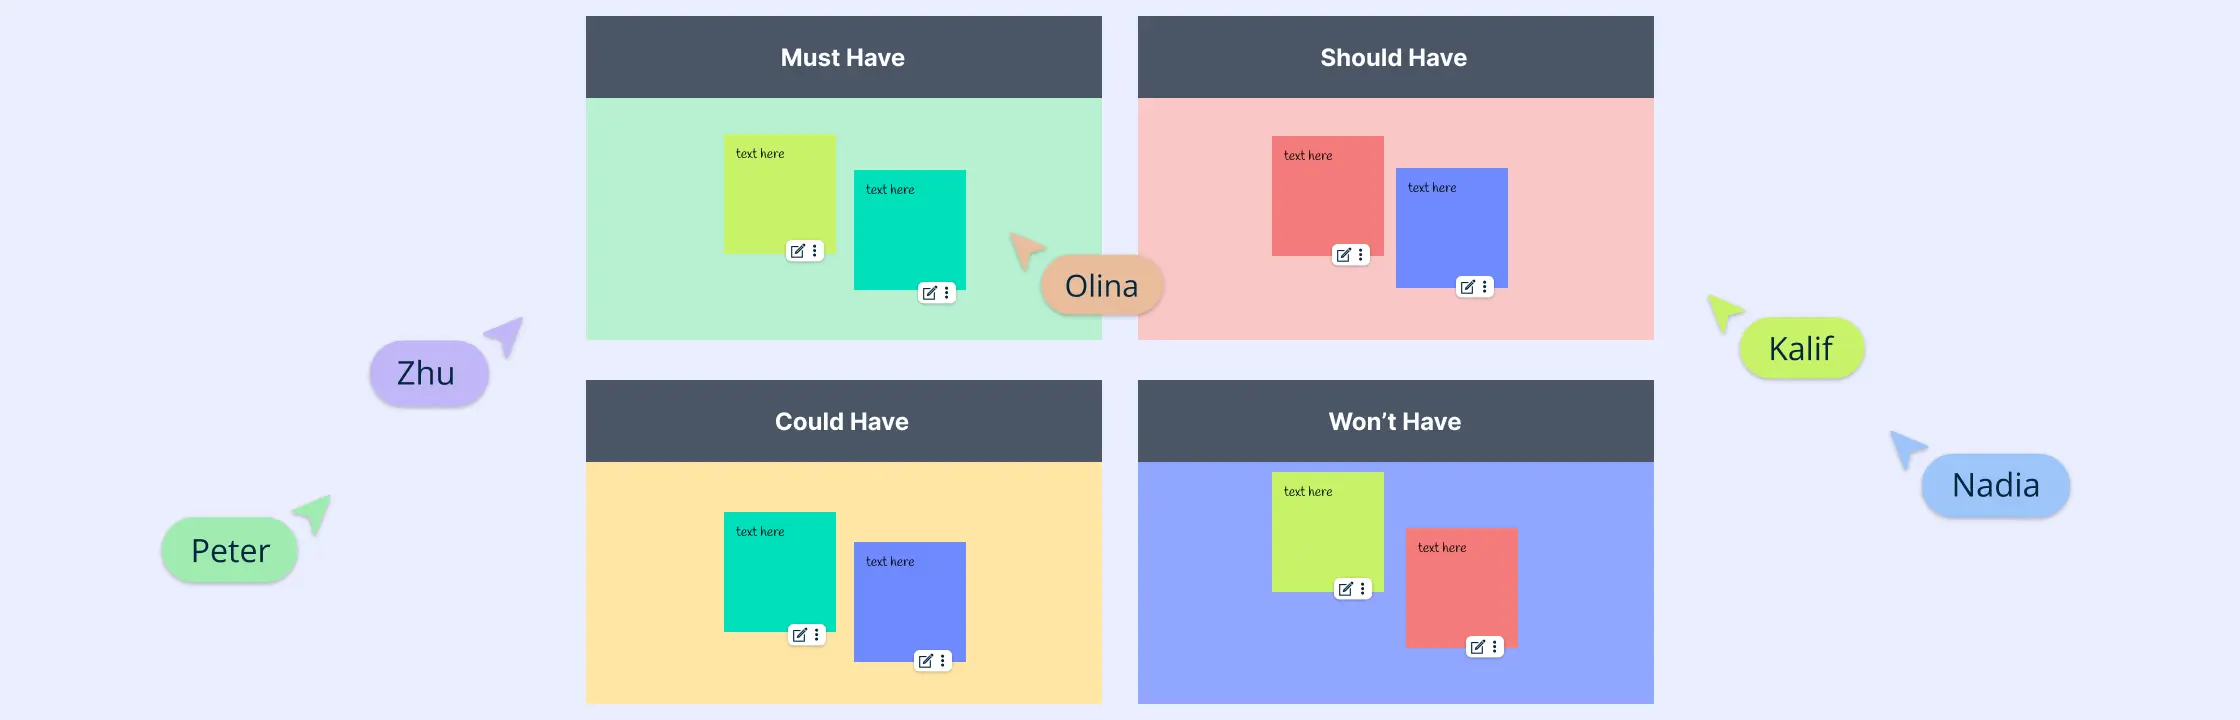
What is the MoSCoW Method? The MoSCoW Method, a widely recognized prioritization technique, is central to effective project management and business analysis. The name MoSCoW is an acronym representing four distinct categories used to classify requirements or tasks: Must have, Should have, Could have, and Won’t have. This method helps teams identify the most critical components needed for project success, ensuring that focus remains on delivering maximum value.
Business analysis techniques are essential tools and methodologies employed by organizations to assess and enhance their processes, strategies, and outcomes. These techniques serve as the foundation for informed decision-making, enabling businesses to identify areas for improvement, anticipate potential challenges, and capitalize on opportunities.
An enterprise resource planning (ERP) implementation changes how work, data, roles, and controls connect across the organization. Software selection is only one part of that change. Teams also need an evidence-based understanding of current processes, business requirements, ownership, handoffs, data dependencies, and the target operating model.
Changing customer expectations, regulations, technologies, and operating conditions can make an undocumented process obsolete quickly. Agile business process mapping applies short feedback cycles and measured, incremental improvement to process management. Teams document the current workflow, identify owners and handoffs, test a proposed change, review the evidence, and update the map when the operating process changes. The result is a living process reference—not an assumption that editing a diagram automatically changes how work is performed.
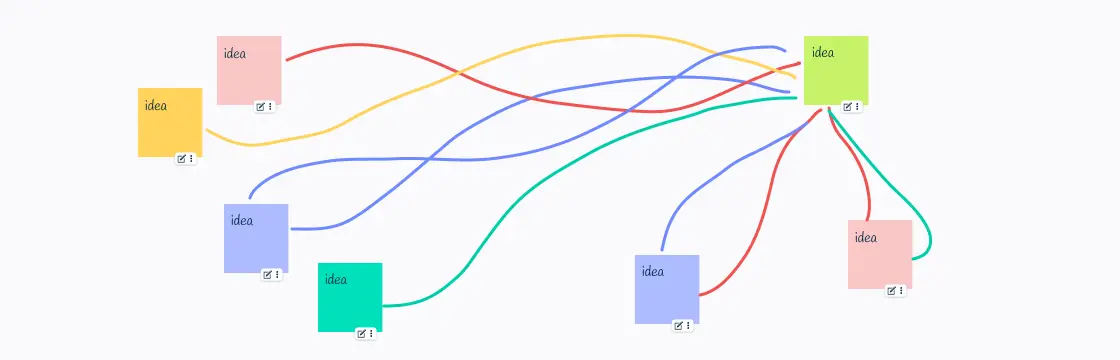
What is a Spaghetti Diagram? A spaghetti diagram is a visual representation that maps out the physical flow of work in a process, highlighting the paths taken by workers, products, and information. It’s a tool that helps identify inefficiencies and areas for improvement by tracing the actual routes and distances covered within a workspace. The primary goal of a spaghetti diagram is to streamline workflows by reducing unnecessary movements and creating a more efficient layout.
Starting a new venture can be both thrilling and challenging, and having the right tools at your disposal can make all the difference. In this guide, we’ve curated a collection of essential templates designed to simplify every aspect of your startup journey. Whether you’re in the initial planning stages or navigating growth and innovation, these startup templates are here to streamline your processes, boost efficiency, and set you on the path to success.
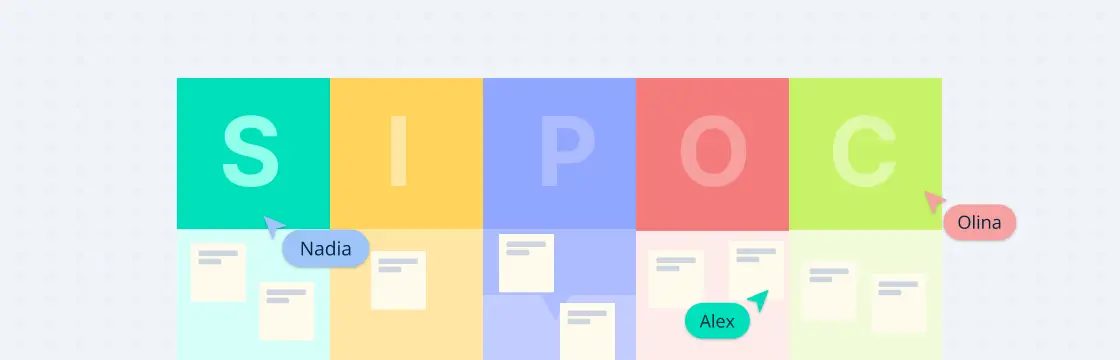
The success of a business operation relies heavily on the clarity of its processes. This is where SIPOC comes in, offering a structured framework for understanding, analyzing, and improving business workflows. SIPOC is used extensively in business process analysis to gain a holistic view of operations.
Business Process Model and Notation (BPMN) is a standard for visualizing and designing business processes. It uses various BPMN symbols to represent different elements in a process. BPMN is a key tool in business process mapping, enabling businesses to document and analyze their workflows for continuous improvement. Check out our guide on BPMN to learn about the Business Process and Modeling Notation in more detail. Here is a complete list of BPMN symbols along with their meanings.
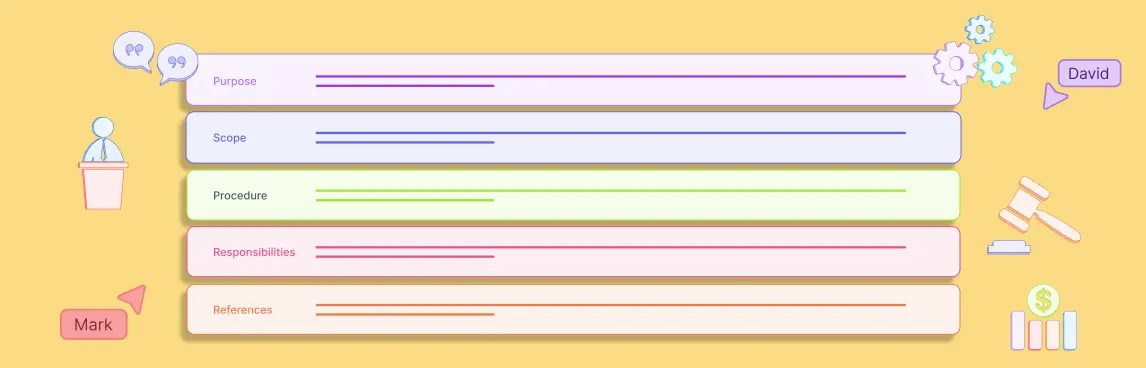
Work instructions are detailed, step-by-step guides that explain how to perform a specific task or activity. They are essential for ensuring quality, safety, efficiency and consistency in any business process. Work instructions can also help to train new employees, comply with regulations, and improve customer satisfaction.
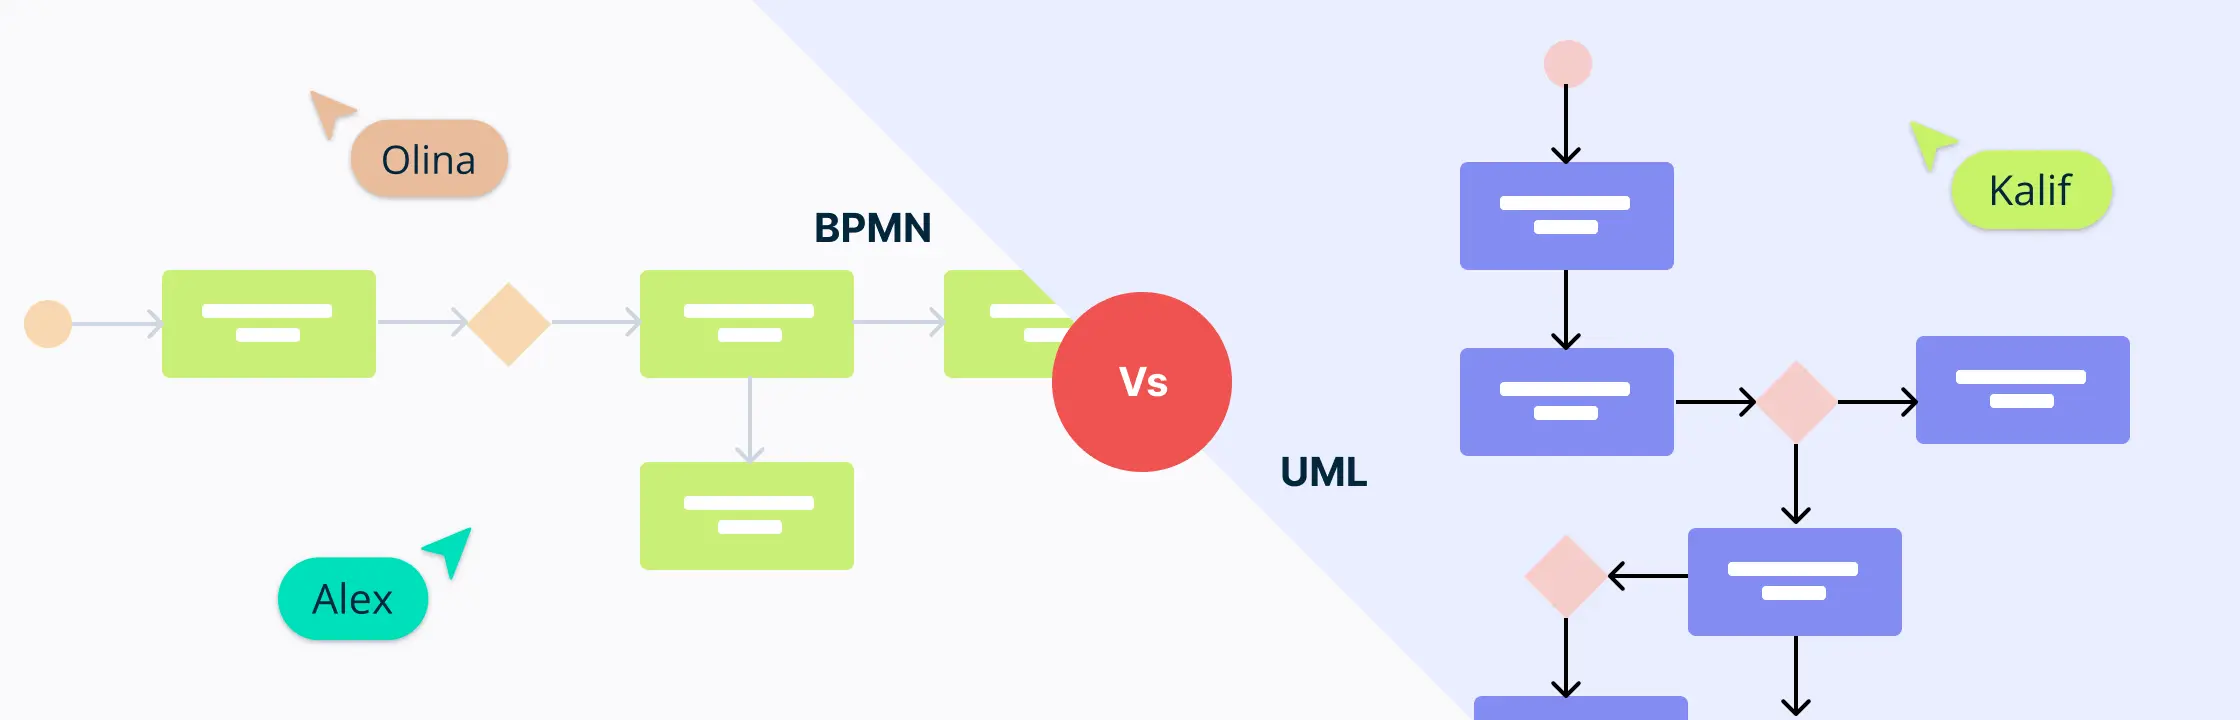
In business and tech, choosing between BPMN vs UML carries significant importance. If you are involved in process modeling, you know these languages are key to improving how organizations work. This short guide compares the basics of BPMN vs UML, helping you make smarter choices for your projects.
In this guide, we will delve into what BPMN is, including its history, when and how to use it, and the benefits it brings to process work. We’ll explore BPMN diagram elements and business process modeling notation symbols, provide examples of practical use, and show how tools like Creately help teams keep BPMN diagrams connected to their supporting process context.
In today’s fast-paced business world, staying competitive requires more than just keeping up — it demands innovation. Organizations need to actively seek new solutions, improve processes, and anticipate future needs. In this guide we will walk you through the steps of the innovation management process helping you foster a culture of innovation within your organizations successfully.
Are you looking for ways to make your business more efficient, productive and profitable? If so, you might want to consider improving your processes. Processes are the steps and actions that you take to deliver your products or services to your customers. They can be formal or informal, simple or complex, but they all have one thing in common: they can always be improved.
Do you often find yourself waiting for days or weeks to get approval for your projects, proposals, or documents? If you answered yes, then this blog post is for you.
Even the most agile teams with the ‘eye of the tiger’ and are laser focused on achieving their goals can run into barriers along the way. When in such mission critical situations, a tiger team is what you need to come up with rapid solutions. Let’s learn more about what tiger teams are and how they can effectively help you to resolve high priority issues.
“Project” and “process” are two distinct concepts often used in the context of work, management, and various industries. Organizations often use both projects and processes to manage their work effectively. Projects may involve creating or improving processes, and processes may be used to carry out the work involved in projects.
Procurement management can sometimes feel never-ending- it is easy to be overwhelmed by the constant invoices and purchase orders flooding your desk every day. You know you need to streamline the process, but with so many moving parts, where do you even start? This guide will walk you through the essentials from requisition all the way to payment - to help you gain control of your p2p operations and give you the insights you need to transform your procure-to-pay process into a strategic powerhouse.
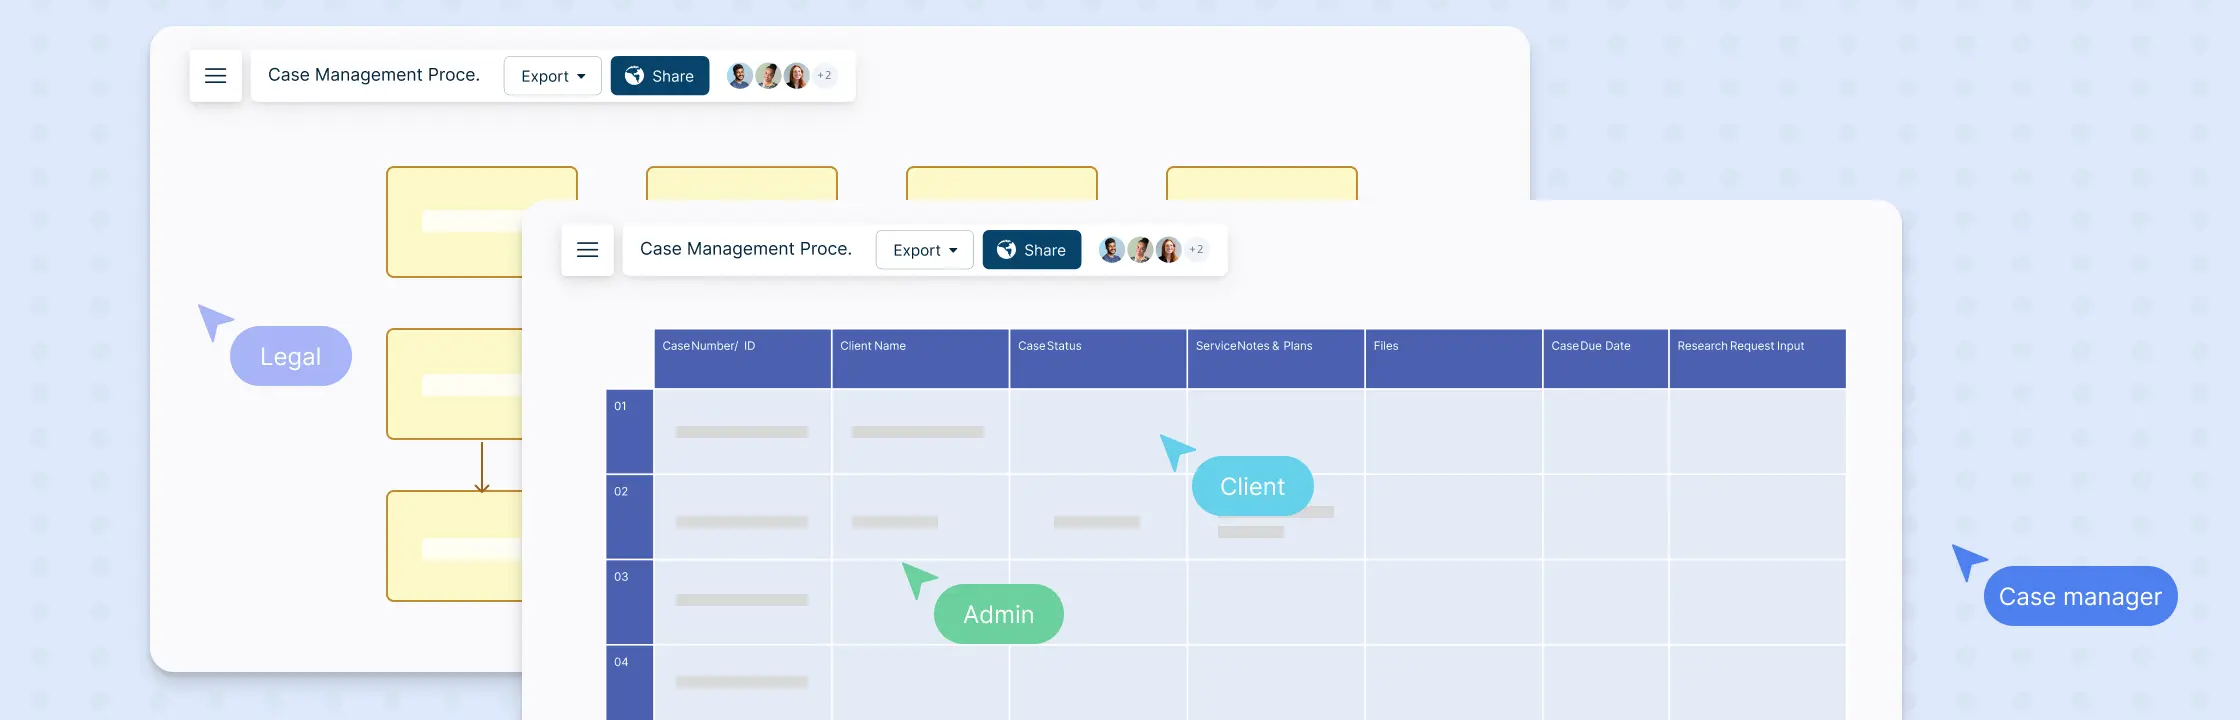
The case management process is effectively applied across various fields to ensure smooth coordination and support for individuals or groups with unique needs. Whether in healthcare, social work, or legal services, case management plays a major role in providing tailored assistance and achieving positive outcomes. In this guide, we’ll break down the core of the case management process, making it easy to understand and apply.
Are you struggling with bottlenecks in your work processes? Do you want to learn how to identify and resolve them effectively? If so, this blog post is for you!
Business process analysis (BPA) is a structured examination of how a defined process currently works, how it performs against its objectives, and what evidence supports a change. It combines current-state mapping, operational data, stakeholder knowledge, root-cause analysis, and outcome measurement.
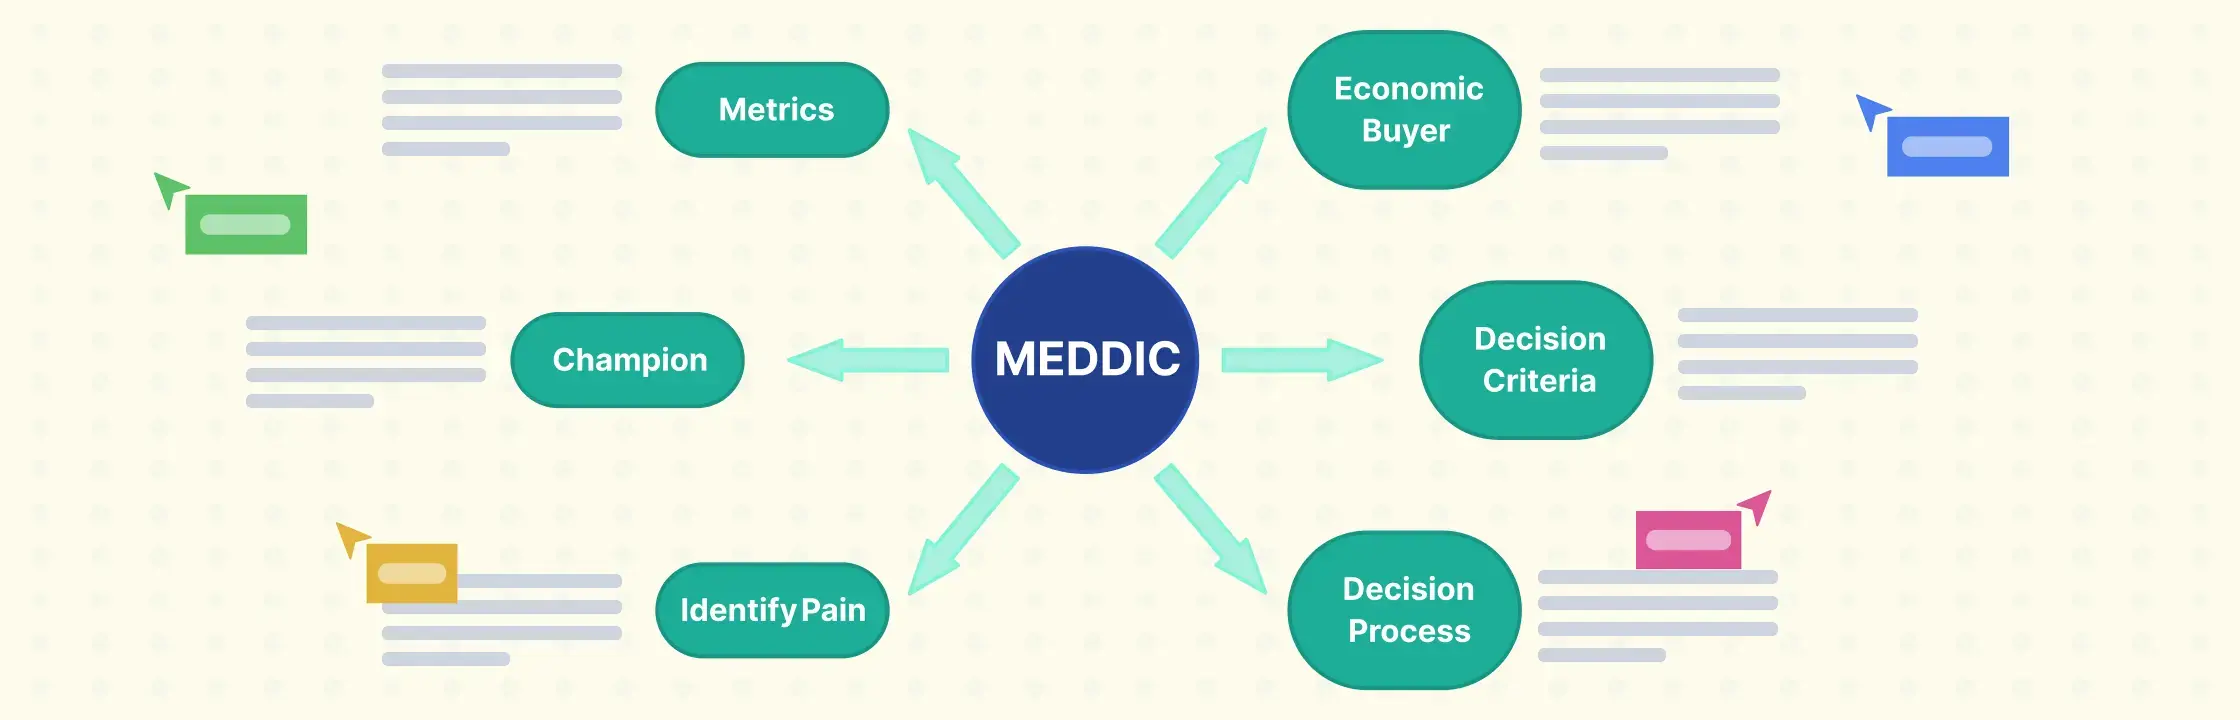
If you’re a salesperson, you know how challenging it can be to close a deal. You have to identify the right prospects, qualify them, understand their pain points, present your solution, overcome objections, and negotiate the terms. And you have to do all this while competing with other vendors and dealing with internal stakeholders.
When we think about “design,” we often visualize the end product—the sleek smartphone, the stylish car, or the user-friendly website. However, the design process is much more than just the act of creating visually appealing items. It’s a systematic approach to problem-solving, one that is essential for solving customer problems effectively.
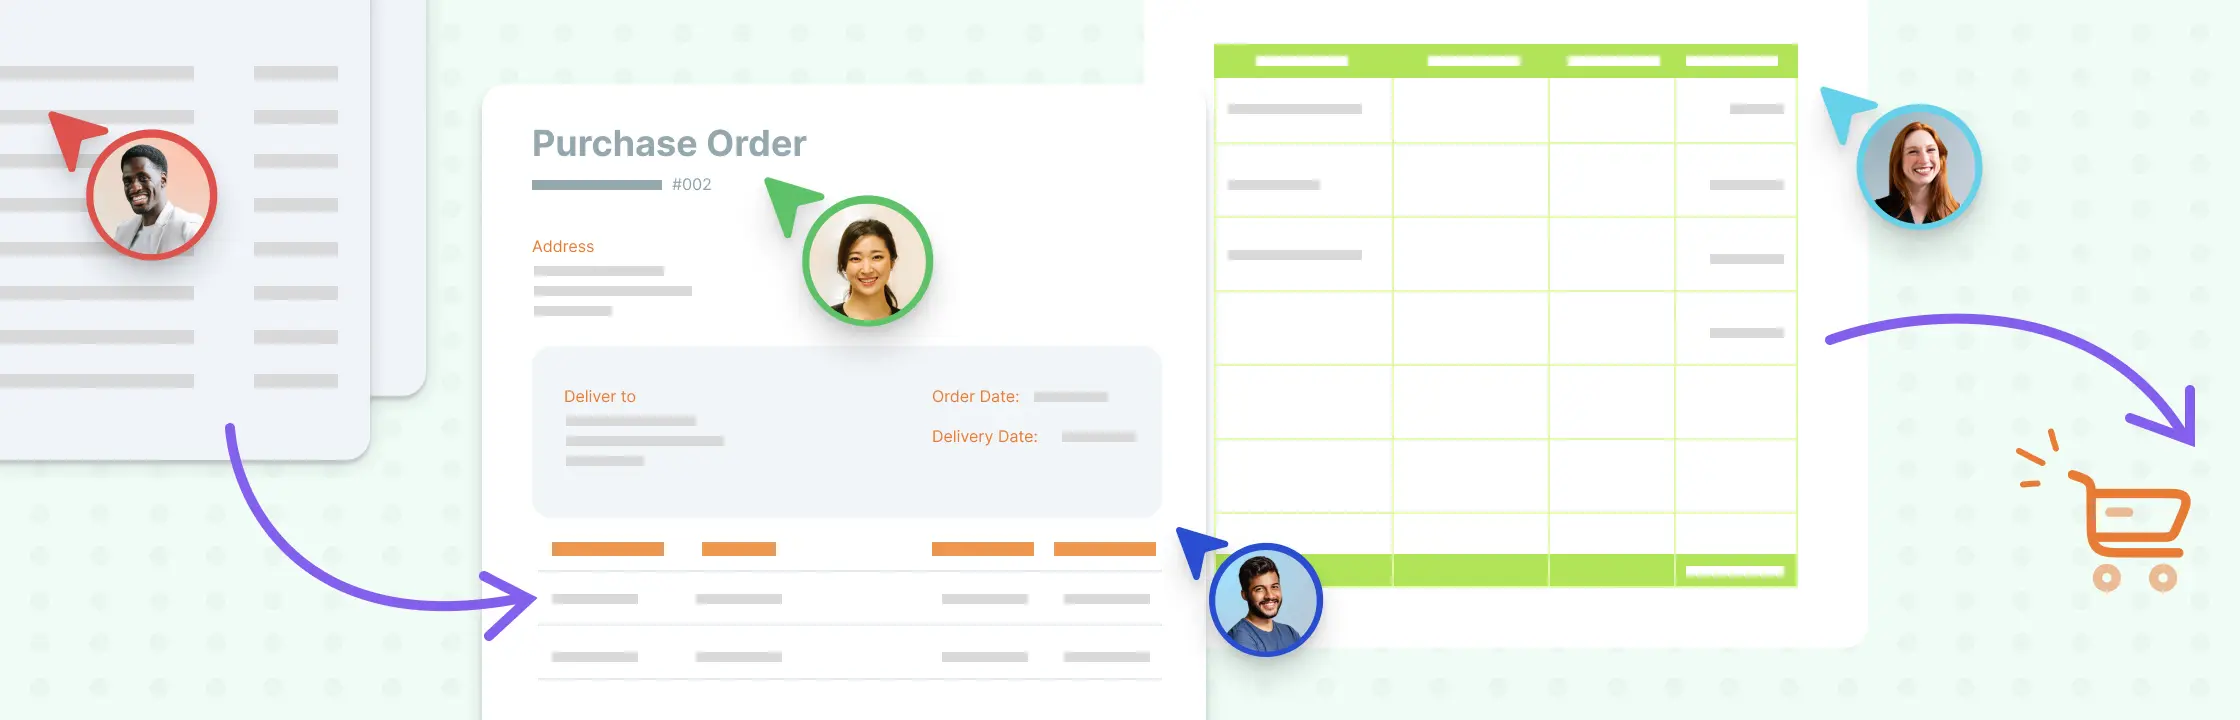
If you’re running a business, you know how important it is to keep track of your purchases and expenses. But do you know what a purchase order is and how it can help you manage your cash flow and inventory? In this blog post, we’ll explain what a purchase order is, how it works, and why you should digitize your purchase order process with Creately.
Capacity planning is the process of determining the resources you need to meet the current and future demands of your business. It helps you optimize your performance, reduce costs, and avoid downtime.
In the high-stakes world of project management, change is inevitable. You may have started a project with a well-defined plan, but as time marches on, things rarely go exactly as expected. Unexpected challenges, stakeholder requests, or evolving business needs can throw a wrench into your carefully laid-out project roadmap. That’s where the change control process comes into play.
Workflows and processes often get mixed up — but they’re not the same. A process is the big picture of how work gets done, while a workflow is the step-by-step path that brings that process to life. Knowing the difference helps teams work faster, find bottlenecks, and automate smarter. In this guide, we’ll break down workflows vs processes, show where they overlap, and share practical examples to help you decide which one your team needs.
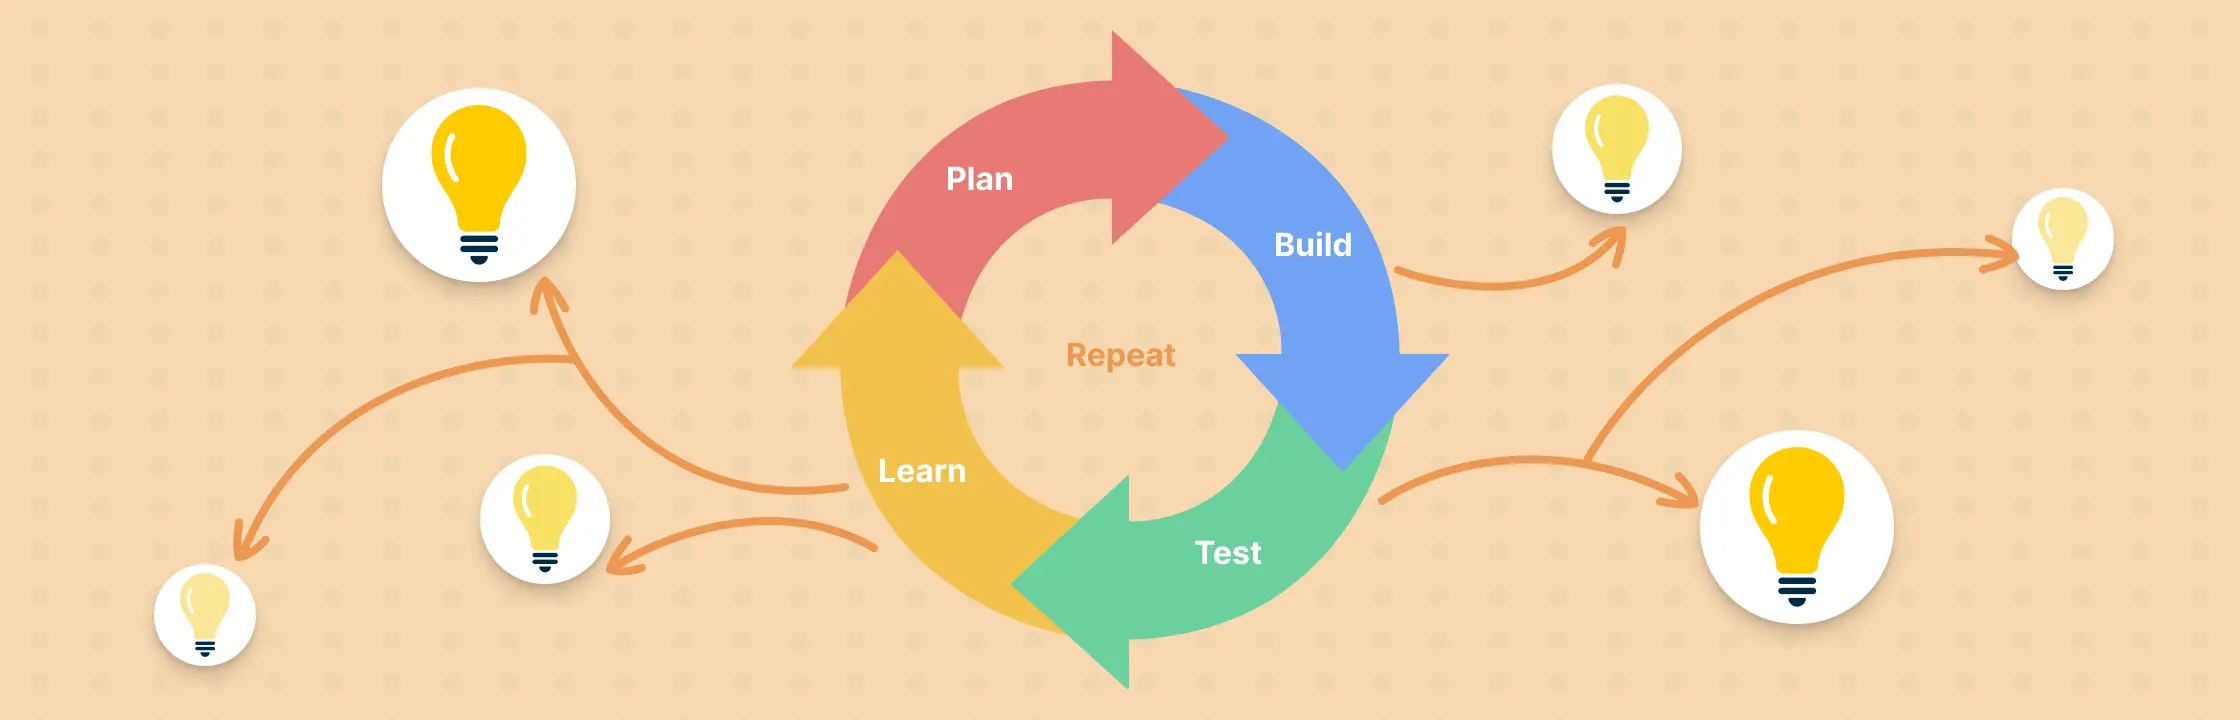
Are you looking for a way to improve your team’s productivity, creativity and collaboration? Do you want to deliver high-quality products or services that meet your customers’ needs and expectations? If so, you need to learn about the iterative process and how to apply it to your projects.
Without risk, there is no innovation. It is good for organizations to have a healthy risk appetite, but it should never be at the compromise of safety and mismanagement.
Can employees’ departure from an organization be as smooth as their arrival? Yes of course! This is where the employee exit process comes into play.
Business process management (BPM) is an effective strategy for improving efficiency, streamlining operations, and aligning work with business goals. In practice, BPM works best when teams can see the process clearly, review it together, and keep documentation connected to how work is actually executed. This guide explains what BPM is, the different types, the lifecycle, templates, and how teams can use it to optimize operations with more consistency.
Change is a constant in the world of business and beyond. From adapting to new technologies to restructuring teams, understanding how to manage change is essential for success. This is where the change management process comes into play - it helps guide individuals and organizations through these changes, minimizing resistance, and achieving objectives efficiently. With this comprehensive guide to the change management process, you can learn how to navigate these transitions more effectively.
Failing to plan is planning to fail. That’s why a business plan is crucial to your business. If you want to make sure that the promising business idea in your head is feasible, you have to start with a business plan.
A standard operations manual is essential to streamlining your business. It defines the roles of employees, what they are responsible for, how to carry out a process, what to do in case of an emergency and so on.
Workflows are the backbone of any team’s work, but without clear rules, even the best workflows can get messy. Workflow guidelines provide a framework to keep work consistent, organized, and efficient.
As your business grows, the work behind it becomes harder to keep consistent. More people, more handoffs, more tools, and more exceptions all make it easier for process knowledge to drift into scattered docs, messages, and individual memory.
What Is a Service Blueprint? Service blueprints help teams visualize how a service is delivered across customer touchpoints, employees, and supporting systems. This guide explains what a service blueprint is, which components matter most, when to create one, how to read it, and how to build one step by step with practical templates.
So you want to learn flowcharts? Well, This flowchart tutorial will teach you all you need to know. It will cover the history of flowcharts, flowchart symbols, how to create flowcharts, flowchart best practices and we’ve also included a section to answer frequent questions about flowcharts. Best of all you can use our flowchart software.
Change is never easy. Especially in a context of business, as it affects a lot of aspects. In order to ensure a smooth transition from the current state to the desired state of business, you need the correct change management tools and resources at hand.
The Business Model Canvas helps teams map how a business creates, delivers, and captures value on a single page. Instead of burying assumptions inside a long business plan, it gives you a shared view of customers, value proposition, operations, revenue, and costs so you can spot gaps faster.
Business process modeling gives teams a shared way to understand how work moves across roles, systems, and decisions. A useful model should make ownership and handoffs clear, connect the process to its supporting context, and remain maintainable as the work changes. The following tips will help you design an effective Business Process Model..
Frustrated with slow workflows, rising costs, or processes that just don’t seem to work? Business Process Reengineering (BPR) offers a powerful way to rethink and redesign your operations for greater efficiency, speed, and results. In this guide, we’ll explore what BPR is, the key steps to implement it, and practical templates you can use to transform your processes and give your organization a competitive edge.